Important differences between barley and sea bass Barley has more manganese, fiber, copper, vitamin B1, iron, zinc, magnesium, and vitamin B2; however, sea bass has more vitamin B12. Sea bass's daily need coverage for vitamin B12 is 184% more. Barley has a higher glycemic index than sea bass. The food varieties used in the comparison are Barley, hulled and Fish, bass, striped, cooked, dry heat .
Infographic
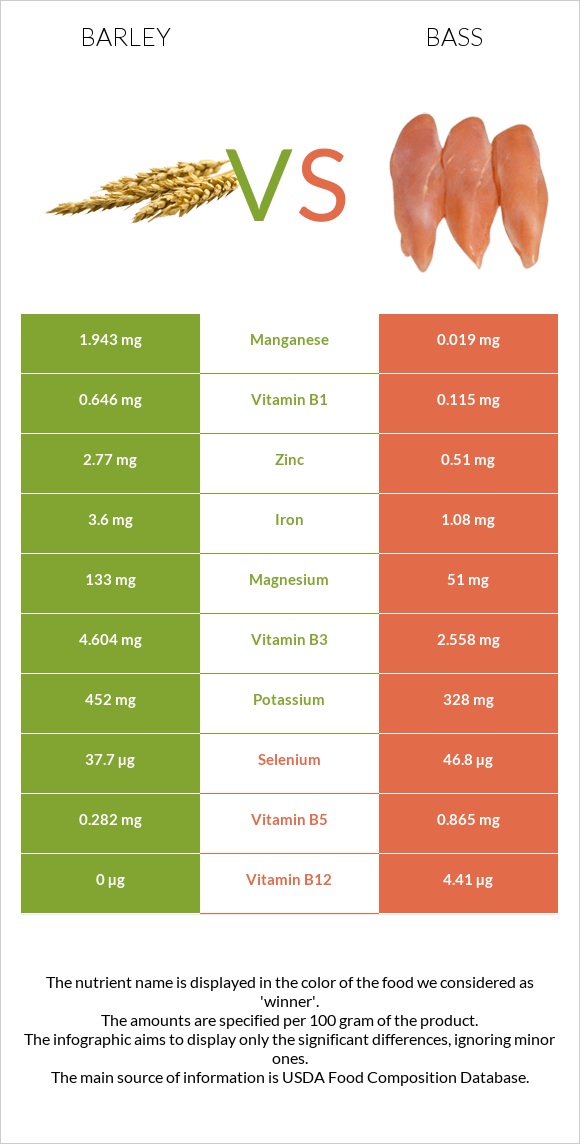
Mineral Comparison
Mineral comparison score is based on the number of minerals by which one or the other food is richer. The "coverage" charts below show how much of the daily needs can be covered by 300 grams of the food.
8
100 g
300 g
1 cup - 184g
Magnesium
Magnesium
Calcium
Calcium
Potassium
Potassium
Iron
Iron
Copper
Copper
Zinc
Zinc
Phosphorus
Phosphorus
Sodium
Sodium
Manganese
Manganese
Selenium
Selenium
95%
9.9%
40%
135%
166%
76%
113%
1.6%
253%
206%
1
100 g
300 g
3 oz - 85g 1 fillet - 124g
Magnesium
Magnesium
Calcium
Calcium
Potassium
Potassium
Iron
Iron
Copper
Copper
Zinc
Zinc
Phosphorus
Phosphorus
Sodium
Sodium
Manganese
Manganese
Selenium
Selenium
36%
5.7%
29%
41%
13%
14%
109%
11%
2.5%
255%
Vitamin Comparison
Vitamin comparison score is based on the number of vitamins by which one or the other food is richer. The "coverage" charts below show how much of the daily needs can be covered by 300 grams of the food.
6
100 g
300 g
1 cup - 184g
Vitamin C
Vit. C
Vitamin D
Vit. D
Vitamin A
Vit. A
Vitamin E
Vit. E
Vitamin B1
Vit. B1
Vitamin B2
Vit. B2
Vitamin B3
Vit. B3
Vitamin B5
Vit. B5
Vitamin B6
Vit. B6
Vitamin B12
Vit. B12
Vitamin K
Vit. K
Folate
Folate
0%
0%
0.33%
11%
162%
66%
86%
17%
73%
0%
5.5%
14%
3
100 g
300 g
3 oz - 85g 1 fillet - 124g
Vitamin C
Vit. C
Vitamin D
Vit. D
Vitamin A
Vit. A
Vitamin E
Vit. E
Vitamin B1
Vit. B1
Vitamin B2
Vit. B2
Vitamin B3
Vit. B3
Vitamin B5
Vit. B5
Vitamin B6
Vit. B6
Vitamin B12
Vit. B12
Vitamin K
Vit. K
Folate
Folate
0%
0%
10%
0%
29%
8.5%
48%
52%
80%
551%
0%
7.5%
All nutrients comparison - raw data values
Nutrient
DV% diff.
Vitamin B12
0µg
4.41µg
184%
Manganese
1.943mg
0.019mg
84%
Fiber
17.3g
0g
69%
Copper
0.498mg
0.04mg
51%
Vitamin B1
0.646mg
0.115mg
44%
Cholesterol
0mg
103mg
34%
Iron
3.6mg
1.08mg
32%
Carbs
73.48g
0g
24%
Protein
12.48g
22.73g
21%
Zinc
2.77mg
0.51mg
21%
Magnesium
133mg
51mg
20%
Vitamin B2
0.285mg
0.037mg
19%
Selenium
37.7µg
46.8µg
17%
Vitamin B3
4.604mg
2.558mg
13%
Calories
354kcal
124kcal
12%
Vitamin B5
0.282mg
0.865mg
12%
Potassium
452mg
328mg
4%
Vitamin E
0.57mg
4%
Sodium
12mg
88mg
3%
Vitamin A
1µg
31µg
3%
Vitamin B6
0.318mg
0.346mg
2%
Vitamin K
2.2µg
2%
Folate
19µg
10µg
2%
Fats
2.3g
2.99g
1%
Calcium
33mg
19mg
1%
Phosphorus
264mg
254mg
1%
Saturated fat
0.482g
0.65g
1%
Monounsaturated fat
0.295g
0.846g
1%
Polyunsaturated fat
1.108g
1.005g
1%
Protein per 100 calories
3.5g
18g
N/A
Calories per 10 g protein
284kcal
55kcal
N/A
Weight per 100 calories
28g
81g
N/A
Unsaturated / Saturated Fat ratio
2.9
2.8
N/A
Net carbs
56.18g
0g
N/A
Sugar
0.8g
N/A
Tryptophan
0.208mg
0.255mg
0%
Threonine
0.424mg
0.997mg
0%
Isoleucine
0.456mg
1.047mg
0%
Leucine
0.848mg
1.848mg
0%
Lysine
0.465mg
2.088mg
0%
Methionine
0.24mg
0.673mg
0%
Phenylalanine
0.7mg
0.887mg
0%
Valine
0.612mg
1.171mg
0%
Histidine
0.281mg
0.669mg
0%
Omega-3 - EPA
0g
0.217g
N/A
Omega-3 - DHA
0g
0.75g
N/A
Macronutrient Comparison
Macronutrient breakdown side-by-side comparison
2
12%
2%
73%
9%
2%
Protein:
12.48 g
Fats:
2.3 g
Carbs:
73.48 g
Water:
9.44 g
Other:
2.3 g
3
23%
3%
73%
Protein:
22.73 g
Fats:
2.99 g
Carbs:
0 g
Water:
73.36 g
Other:
0.92 g
Contains
more
Carbs Carbs
+∞%
Contains
more
Other Other
+150%
Contains
more
Protein Protein
+82.1%
Contains
more
Fats Fats
+30%
Contains
more
Water Water
+677.1%
Fat Type Comparison
Fat type breakdown side-by-side comparison
2
26%
16%
59%
Saturated fat:
Sat. Fat
0.482 g
Monounsaturated fat:
Mono. Fat
0.295 g
Polyunsaturated fat:
Poly. Fat
1.108 g
1
26%
34%
40%
Saturated fat:
Sat. Fat
0.65 g
Monounsaturated fat:
Mono. Fat
0.846 g
Polyunsaturated fat:
Poly. Fat
1.005 g
Contains
less
Sat. Fat Saturated fat
-25.8%
Contains
more
Mono. Fat Monounsaturated fat
+186.8%
~equal in
Polyunsaturated fat
~1.005g