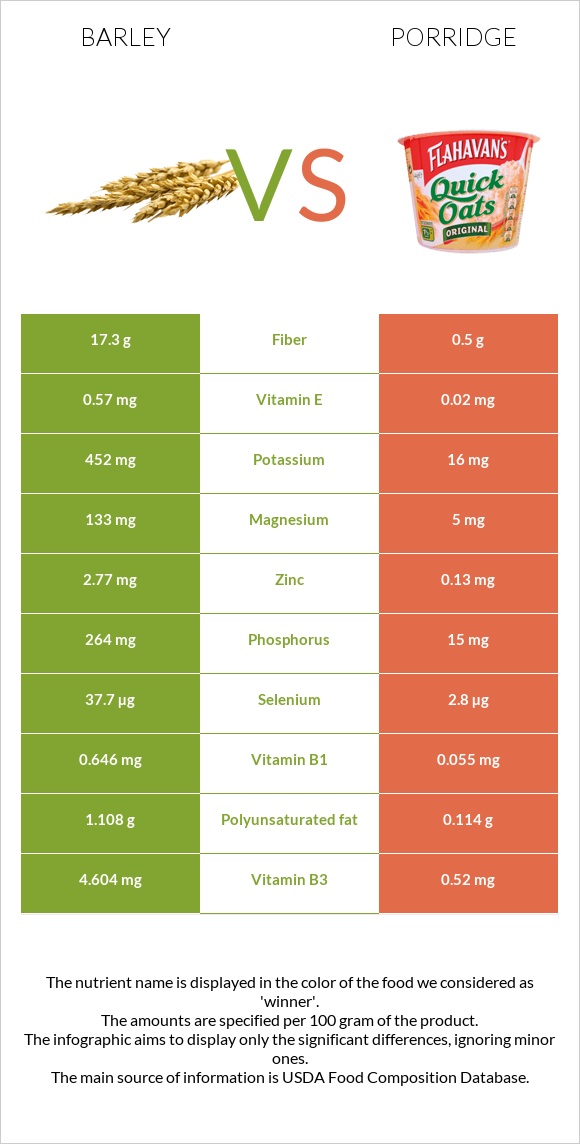
What are the differences between barley and porridge? Barley is richer than porridge in manganese, fiber, selenium, copper, vitamin B1, phosphorus, magnesium, vitamin B3, zinc, and vitamin B6. Barley's daily need coverage for manganese is 84% more. Barley has 35 times more fiber than porridge. While barley has 17.3g of fiber, porridge has only 0.5g. The glycemic index of barley is lower. We used Barley, hulled and Cereals, CREAM OF WHEAT, regular (10 minute), cooked with water, without salt types in this article.
Infographic
Mineral Comparison
Mineral comparison score is based on the number of minerals by which one or the other food is richer. The "coverage" charts below show how much of the daily needs can be covered by 300 grams of the food.
7
100 g
300 g
1 cup - 184g
Magnesium
Magnesium
Calcium
Calcium
Potassium
Potassium
Iron
Iron
Copper
Copper
Zinc
Zinc
Phosphorus
Phosphorus
Sodium
Sodium
Manganese
Manganese
Selenium
Selenium
95%
9.9%
40%
135%
166%
76%
113%
1.6%
253%
206%
2
100 g
300 g
1 tbsp - 16g 1 cup (1 serving) - 251g
Magnesium
Magnesium
Calcium
Calcium
Potassium
Potassium
Iron
Iron
Copper
Copper
Zinc
Zinc
Phosphorus
Phosphorus
Sodium
Sodium
Manganese
Manganese
Selenium
Selenium
3.6%
26%
1.4%
140%
13%
3.5%
6.4%
0.78%
0%
15%
Vitamin Comparison
Vitamin comparison score is based on the number of vitamins by which one or the other food is richer. The "coverage" charts below show how much of the daily needs can be covered by 300 grams of the food.
9
100 g
300 g
1 cup - 184g
Vitamin C
Vit. C
Vitamin D
Vit. D
Vitamin A
Vit. A
Vitamin E
Vit. E
Vitamin B1
Vit. B1
Vitamin B2
Vit. B2
Vitamin B3
Vit. B3
Vitamin B5
Vit. B5
Vitamin B6
Vit. B6
Vitamin B12
Vit. B12
Vitamin K
Vit. K
Folate
Folate
0%
0%
0.33%
11%
162%
66%
86%
17%
73%
0%
5.5%
14%
0
100 g
300 g
1 tbsp - 16g 1 cup (1 serving) - 251g
Vitamin C
Vit. C
Vitamin D
Vit. D
Vitamin A
Vit. A
Vitamin E
Vit. E
Vitamin B1
Vit. B1
Vitamin B2
Vit. B2
Vitamin B3
Vit. B3
Vitamin B5
Vit. B5
Vitamin B6
Vit. B6
Vitamin B12
Vit. B12
Vitamin K
Vit. K
Folate
Folate
0%
0%
0%
0.4%
14%
5.8%
9.8%
4.3%
3%
0%
0.25%
9%
All nutrients comparison - raw data values
Nutrient
DV% diff.
Manganese
1.943mg
0mg
84%
Fiber
17.3g
0.5g
67%
Selenium
37.7µg
2.8µg
63%
Copper
0.498mg
0.04mg
51%
Vitamin B1
0.646mg
0.055mg
49%
Phosphorus
264mg
15mg
36%
Magnesium
133mg
5mg
30%
Vitamin B3
4.604mg
0.52mg
26%
Zinc
2.77mg
0.13mg
24%
Vitamin B6
0.318mg
0.013mg
23%
Protein
12.48g
1.44g
22%
Carbs
73.48g
10.52g
21%
Vitamin B2
0.285mg
0.025mg
20%
Calories
354kcal
50kcal
15%
Potassium
452mg
16mg
13%
Polyunsaturated fat
1.108g
0.114g
7%
Calcium
33mg
87mg
5%
Vitamin E
0.57mg
0.02mg
4%
Vitamin B5
0.282mg
0.071mg
4%
Fats
2.3g
0.21g
3%
Iron
3.6mg
3.74mg
2%
Vitamin K
2.2µg
0.1µg
2%
Folate
19µg
12µg
2%
Saturated fat
0.482g
0.033g
2%
Monounsaturated fat
0.295g
0.028g
1%
Protein per 100 calories
3.5g
2.9g
N/A
Calories per 10 g protein
284kcal
347kcal
N/A
Weight per 100 calories
28g
200g
N/A
Unsaturated / Saturated Fat ratio
2.9
4.3
N/A
Net carbs
56.18g
10.02g
N/A
Sugar
0.8g
0.03g
N/A
Sodium
12mg
6mg
0%
Vitamin A
1µg
0µg
0%
Tryptophan
0.208mg
0.02mg
0%
Threonine
0.424mg
0.045mg
0%
Isoleucine
0.456mg
0.063mg
0%
Leucine
0.848mg
0.11mg
0%
Lysine
0.465mg
0.037mg
0%
Methionine
0.24mg
0.027mg
0%
Phenylalanine
0.7mg
0.078mg
0%
Valine
0.612mg
0.07mg
0%
Histidine
0.281mg
0.033mg
0%
Macronutrient Comparison
Macronutrient breakdown side-by-side comparison
4
12%
2%
73%
9%
2%
Protein:
12.48 g
Fats:
2.3 g
Carbs:
73.48 g
Water:
9.44 g
Other:
2.3 g
1
11%
88%
Protein:
1.44 g
Fats:
0.21 g
Carbs:
10.52 g
Water:
87.61 g
Other:
0.22 g
Contains
more
Protein Protein
+766.7%
Contains
more
Fats Fats
+995.2%
Contains
more
Carbs Carbs
+598.5%
Contains
more
Other Other
+945.5%
Contains
more
Water Water
+828.1%
Fat Type Comparison
Fat type breakdown side-by-side comparison
2
26%
16%
59%
Saturated fat:
Sat. Fat
0.482 g
Monounsaturated fat:
Mono. Fat
0.295 g
Polyunsaturated fat:
Poly. Fat
1.108 g
1
19%
16%
65%
Saturated fat:
Sat. Fat
0.033 g
Monounsaturated fat:
Mono. Fat
0.028 g
Polyunsaturated fat:
Poly. Fat
0.114 g
Contains
more
Mono. Fat Monounsaturated fat
+953.6%
Contains
more
Poly. Fat Polyunsaturated fat
+871.9%
Contains
less
Sat. Fat Saturated fat
-93.2%