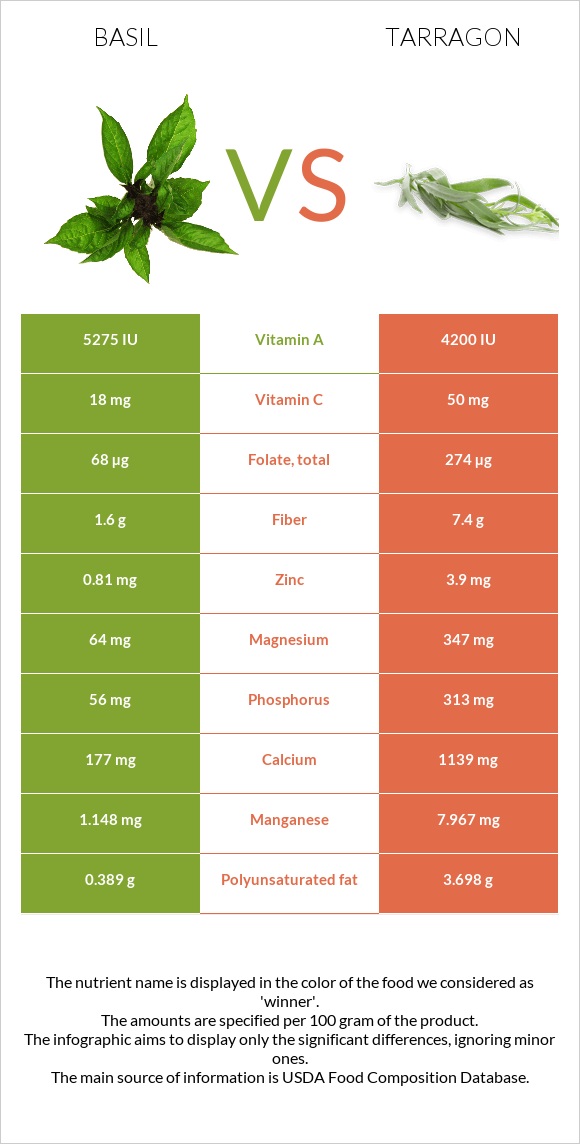
A recap on the differences between basil and tarragon Basil has less iron, manganese, vitamin B6, vitamin B2, calcium, potassium, magnesium, folate, vitamin B3, and phosphorus. Tarragon covers your daily iron needs 364% more than basil. The glycemic index of basil is higher. Food varieties used in this article are Basil, fresh and Spices, tarragon, dried .
Infographic
Mineral Comparison
Mineral comparison score is based on the number of minerals by which one or the other food is richer. The "coverage" charts below show how much of the daily needs can be covered by 300 grams of the food.
1
100 g
300 g
5 leaves - 2.5g 2 tbsp, chopped - 5.3g 0.25 cup leaves, whole - 6g
Magnesium
Magnesium
Calcium
Calcium
Potassium
Potassium
Iron
Iron
Copper
Copper
Zinc
Zinc
Phosphorus
Phosphorus
Sodium
Sodium
Manganese
Manganese
Selenium
Selenium
46%
53%
26%
119%
128%
22%
24%
0.52%
150%
1.6%
9
100 g
300 g
0.25 tsp - 0.5g 1 tsp, ground - 1.6g 1 tbsp, leaves - 1.8g 1 tbsp, ground - 4.8g
Magnesium
Magnesium
Calcium
Calcium
Potassium
Potassium
Iron
Iron
Copper
Copper
Zinc
Zinc
Phosphorus
Phosphorus
Sodium
Sodium
Manganese
Manganese
Selenium
Selenium
248%
342%
266%
1211%
226%
106%
134%
8.1%
1039%
24%
Vitamin Comparison
Vitamin comparison score is based on the number of vitamins by which one or the other food is richer. The "coverage" charts below show how much of the daily needs can be covered by 300 grams of the food.
4
100 g
300 g
5 leaves - 2.5g 2 tbsp, chopped - 5.3g 0.25 cup leaves, whole - 6g
Vitamin C
Vit. C
Vitamin D
Vit. D
Vitamin A
Vit. A
Vitamin E
Vit. E
Vitamin B1
Vit. B1
Vitamin B2
Vit. B2
Vitamin B3
Vit. B3
Vitamin B5
Vit. B5
Vitamin B6
Vit. B6
Vitamin B12
Vit. B12
Vitamin K
Vit. K
Folate
Folate
60%
0%
88%
16%
8.5%
18%
17%
13%
36%
0%
1037%
51%
6
100 g
300 g
0.25 tsp - 0.5g 1 tsp, ground - 1.6g 1 tbsp, leaves - 1.8g 1 tbsp, ground - 4.8g
Vitamin C
Vit. C
Vitamin D
Vit. D
Vitamin A
Vit. A
Vitamin E
Vit. E
Vitamin B1
Vit. B1
Vitamin B2
Vit. B2
Vitamin B3
Vit. B3
Vitamin B5
Vit. B5
Vitamin B6
Vit. B6
Vitamin B12
Vit. B12
Vitamin K
Vit. K
Folate
Folate
167%
0%
70%
0%
63%
309%
168%
0%
556%
0%
0%
206%
All nutrients comparison - raw data values
Nutrient
DV% diff.
Iron
3.17mg
32.3mg
364%
Vitamin K
414.8µg
346%
Manganese
1.148mg
7.967mg
296%
Vitamin B6
0.155mg
2.41mg
173%
Vitamin B2
0.076mg
1.339mg
97%
Calcium
177mg
1139mg
96%
Potassium
295mg
3020mg
80%
Magnesium
64mg
347mg
67%
Folate
68µg
274µg
52%
Vitamin B3
0.902mg
8.95mg
50%
Protein
3.15g
22.77g
39%
Phosphorus
56mg
313mg
37%
Vitamin C
18mg
50mg
36%
Copper
0.385mg
0.677mg
32%
Zinc
0.81mg
3.9mg
28%
Fiber
1.6g
7.4g
23%
Polyunsaturated fat
0.389g
3.698g
22%
Vitamin B1
0.034mg
0.251mg
18%
Carbs
2.65g
50.22g
16%
Calories
23kcal
295kcal
14%
Fats
0.64g
7.24g
10%
Saturated fat
0.041g
1.881g
8%
Selenium
0.3µg
4.4µg
7%
Vitamin A
264µg
210µg
6%
Vitamin E
0.8mg
5%
Vitamin B5
0.209mg
4%
Sodium
4mg
62mg
3%
Choline
11.4mg
2%
Monounsaturated fat
0.088g
0.474g
1%
Protein per 100 calories
14g
7.7g
N/A
Calories per 10 g protein
73kcal
130kcal
N/A
Weight per 100 calories
435g
34g
N/A
Unsaturated / Saturated Fat ratio
12
2.2
N/A
Net carbs
1.05g
42.82g
N/A
Sugar
0.3g
N/A
Tryptophan
0.039mg
0%
Threonine
0.104mg
0%
Isoleucine
0.104mg
0%
Leucine
0.191mg
0%
Lysine
0.11mg
0%
Methionine
0.036mg
0%
Phenylalanine
0.13mg
0%
Valine
0.127mg
0%
Histidine
0.051mg
0%
Fructose
0.02g
0%
Macronutrient Comparison
Macronutrient breakdown side-by-side comparison
1
3%
3%
92%
Protein:
3.15 g
Fats:
0.64 g
Carbs:
2.65 g
Water:
92.06 g
Other:
1.5 g
4
23%
7%
50%
8%
12%
Protein:
22.77 g
Fats:
7.24 g
Carbs:
50.22 g
Water:
7.74 g
Other:
12.03 g
Contains
more
Water Water
+1089.4%
Contains
more
Protein Protein
+622.9%
Contains
more
Fats Fats
+1031.3%
Contains
more
Carbs Carbs
+1795.1%
Contains
more
Other Other
+702%
Fat Type Comparison
Fat type breakdown side-by-side comparison
1
8%
17%
75%
Saturated fat:
Sat. Fat
0.041 g
Monounsaturated fat:
Mono. Fat
0.088 g
Polyunsaturated fat:
Poly. Fat
0.389 g
2
31%
8%
61%
Saturated fat:
Sat. Fat
1.881 g
Monounsaturated fat:
Mono. Fat
0.474 g
Polyunsaturated fat:
Poly. Fat
3.698 g
Contains
less
Sat. Fat Saturated fat
-97.8%
Contains
more
Mono. Fat Monounsaturated fat
+438.6%
Contains
more
Poly. Fat Polyunsaturated fat
+850.6%