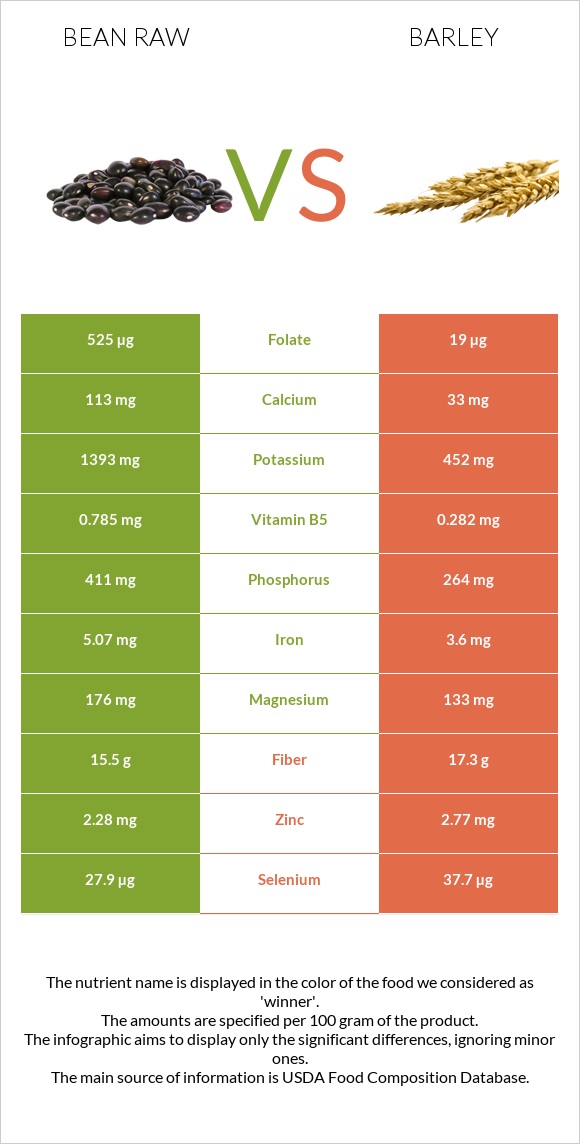
What are the main differences between bean raw and barley? Bean raw is richer in folate, copper, potassium, phosphorus, iron, vitamin B6, and magnesium, yet barley is richer in manganese, vitamin B3, and selenium. Bean raw's daily need coverage for folate is 127% higher. Bean raw has 3 times more potassium than barley. Bean raw has 1393mg of potassium, while barley has 452mg. We used Beans, pinto, mature seeds, raw and Barley, hulled types in this comparison.
Infographic
Mineral Comparison
Mineral comparison score is based on the number of minerals by which one or the other food is richer. The "coverage" charts below show how much of the daily needs can be covered by 300 grams of the food.
6
100 g
300 g
1 tbsp - 12g 1 cup - 193g
Magnesium
Magnesium
Calcium
Calcium
Potassium
Potassium
Iron
Iron
Copper
Copper
Zinc
Zinc
Phosphorus
Phosphorus
Sodium
Sodium
Manganese
Manganese
Selenium
Selenium
126%
34%
123%
190%
298%
62%
176%
1.6%
150%
152%
3
100 g
300 g
1 cup - 184g
Magnesium
Magnesium
Calcium
Calcium
Potassium
Potassium
Iron
Iron
Copper
Copper
Zinc
Zinc
Phosphorus
Phosphorus
Sodium
Sodium
Manganese
Manganese
Selenium
Selenium
95%
9.9%
40%
135%
166%
76%
113%
1.6%
253%
206%
Vitamin Comparison
Vitamin comparison score is based on the number of vitamins by which one or the other food is richer. The "coverage" charts below show how much of the daily needs can be covered by 300 grams of the food.
5
100 g
300 g
1 tbsp - 12g 1 cup - 193g
Vitamin C
Vit. C
Vitamin D
Vit. D
Vitamin A
Vit. A
Vitamin E
Vit. E
Vitamin B1
Vit. B1
Vitamin B2
Vit. B2
Vitamin B3
Vit. B3
Vitamin B5
Vit. B5
Vitamin B6
Vit. B6
Vitamin B12
Vit. B12
Vitamin K
Vit. K
Folate
Folate
21%
0%
0%
4.2%
178%
49%
22%
47%
109%
0%
14%
394%
4
100 g
300 g
1 cup - 184g
Vitamin C
Vit. C
Vitamin D
Vit. D
Vitamin A
Vit. A
Vitamin E
Vit. E
Vitamin B1
Vit. B1
Vitamin B2
Vit. B2
Vitamin B3
Vit. B3
Vitamin B5
Vit. B5
Vitamin B6
Vit. B6
Vitamin B12
Vit. B12
Vitamin K
Vit. K
Folate
Folate
0%
0%
0.33%
11%
162%
66%
86%
17%
73%
0%
5.5%
14%
All nutrients comparison - raw data values
Nutrient
DV% diff.
Folate
525µg
19µg
127%
Copper
0.893mg
0.498mg
44%
Manganese
1.148mg
1.943mg
35%
Potassium
1393mg
452mg
28%
Phosphorus
411mg
264mg
21%
Vitamin B3
1.174mg
4.604mg
21%
Protein
21.42g
12.48g
18%
Iron
5.07mg
3.6mg
18%
Selenium
27.9µg
37.7µg
18%
Starch
34.17g
14%
Vitamin B6
0.474mg
0.318mg
12%
Choline
66.2mg
12%
Magnesium
176mg
133mg
10%
Vitamin B5
0.785mg
0.282mg
10%
Calcium
113mg
33mg
8%
Vitamin C
6.3mg
0mg
7%
Fiber
15.5g
17.3g
7%
Vitamin B1
0.713mg
0.646mg
6%
Vitamin B2
0.212mg
0.285mg
6%
Polyunsaturated fat
0.407g
1.108g
5%
Carbs
62.55g
73.48g
4%
Zinc
2.28mg
2.77mg
4%
Vitamin K
5.6µg
2.2µg
3%
Fats
1.23g
2.3g
2%
Vitamin E
0.21mg
0.57mg
2%
Saturated fat
0.235g
0.482g
1%
Calories
347kcal
354kcal
0%
Protein per 100 calories
6.2g
3.5g
N/A
Calories per 10 g protein
162kcal
284kcal
N/A
Weight per 100 calories
29g
28g
N/A
Unsaturated / Saturated Fat ratio
2.7
2.9
N/A
Net carbs
47.05g
56.18g
N/A
Sugar
2.11g
0.8g
N/A
Sodium
12mg
12mg
0%
Vitamin A
0µg
1µg
0%
Monounsaturated fat
0.229g
0.295g
0%
Tryptophan
0.237mg
0.208mg
0%
Threonine
0.81mg
0.424mg
0%
Isoleucine
0.871mg
0.456mg
0%
Leucine
1.558mg
0.848mg
0%
Lysine
1.356mg
0.465mg
0%
Methionine
0.259mg
0.24mg
0%
Phenylalanine
1.095mg
0.7mg
0%
Valine
0.998mg
0.612mg
0%
Histidine
0.556mg
0.281mg
0%
Macronutrient Comparison
Macronutrient breakdown side-by-side comparison
3
21%
63%
11%
3%
Protein:
21.42 g
Fats:
1.23 g
Carbs:
62.55 g
Water:
11.33 g
Other:
3.47 g
2
12%
2%
73%
9%
2%
Protein:
12.48 g
Fats:
2.3 g
Carbs:
73.48 g
Water:
9.44 g
Other:
2.3 g
Contains
more
Protein Protein
+71.6%
Contains
more
Water Water
+20%
Contains
more
Other Other
+50.9%
Contains
more
Fats Fats
+87%
Contains
more
Carbs Carbs
+17.5%
Fat Type Comparison
Fat type breakdown side-by-side comparison
1
27%
26%
47%
Saturated fat:
Sat. Fat
0.235 g
Monounsaturated fat:
Mono. Fat
0.229 g
Polyunsaturated fat:
Poly. Fat
0.407 g
2
26%
16%
59%
Saturated fat:
Sat. Fat
0.482 g
Monounsaturated fat:
Mono. Fat
0.295 g
Polyunsaturated fat:
Poly. Fat
1.108 g
Contains
less
Sat. Fat Saturated fat
-51.2%
Contains
more
Mono. Fat Monounsaturated fat
+28.8%
Contains
more
Poly. Fat Polyunsaturated fat
+172.2%