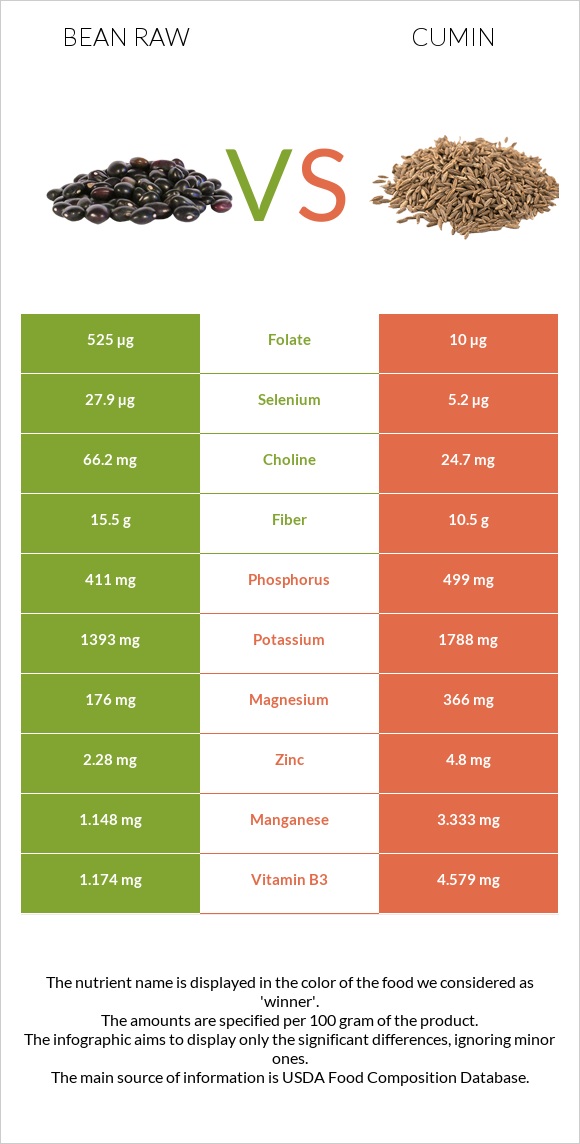
What are the main differences between bean raw and cumin? Bean raw is richer in folate and selenium, yet cumin is richer in iron, manganese, calcium, magnesium, vitamin A, zinc, vitamin B3, and vitamin E. Cumin's daily need coverage for iron is 766% higher. Bean raw has 53 times more folate than cumin. Bean raw has 525µg of folate, while cumin has 10µg. Cumin has a lower glycemic index than bean raw. We used Beans, pinto, mature seeds, raw and Spices, cumin seed types in this comparison.
Infographic
Mineral Comparison
Mineral comparison score is based on the number of minerals by which one or the other food is richer. The "coverage" charts below show how much of the daily needs can be covered by 300 grams of the food.
2
100 g
300 g
1 tbsp - 12g 1 cup - 193g
Magnesium
Magnesium
Calcium
Calcium
Potassium
Potassium
Iron
Iron
Copper
Copper
Zinc
Zinc
Phosphorus
Phosphorus
Sodium
Sodium
Manganese
Manganese
Selenium
Selenium
126%
34%
123%
190%
298%
62%
176%
1.6%
150%
152%
7
100 g
300 g
0.25 tsp, whole - 0.5g 1 tbsp, whole - 6g
Magnesium
Magnesium
Calcium
Calcium
Potassium
Potassium
Iron
Iron
Copper
Copper
Zinc
Zinc
Phosphorus
Phosphorus
Sodium
Sodium
Manganese
Manganese
Selenium
Selenium
261%
279%
158%
2489%
289%
131%
214%
22%
435%
28%
Vitamin Comparison
Vitamin comparison score is based on the number of vitamins by which one or the other food is richer. The "coverage" charts below show how much of the daily needs can be covered by 300 grams of the food.
3
100 g
300 g
1 tbsp - 12g 1 cup - 193g
Vitamin C
Vit. C
Vitamin D
Vit. D
Vitamin A
Vit. A
Vitamin E
Vit. E
Vitamin B1
Vit. B1
Vitamin B2
Vit. B2
Vitamin B3
Vit. B3
Vitamin B5
Vit. B5
Vitamin B6
Vit. B6
Vitamin B12
Vit. B12
Vitamin K
Vit. K
Folate
Folate
21%
0%
0%
4.2%
178%
49%
22%
47%
109%
0%
14%
394%
5
100 g
300 g
0.25 tsp, whole - 0.5g 1 tbsp, whole - 6g
Vitamin C
Vit. C
Vitamin D
Vit. D
Vitamin A
Vit. A
Vitamin E
Vit. E
Vitamin B1
Vit. B1
Vitamin B2
Vit. B2
Vitamin B3
Vit. B3
Vitamin B5
Vit. B5
Vitamin B6
Vit. B6
Vitamin B12
Vit. B12
Vitamin K
Vit. K
Folate
Folate
26%
0%
21%
67%
157%
75%
86%
0%
100%
0%
14%
7.5%
All nutrients comparison - raw data values
Nutrient
DV% diff.
Iron
5.07mg
66.36mg
766%
Folate
525µg
10µg
129%
Manganese
1.148mg
3.333mg
95%
Calcium
113mg
931mg
82%
Magnesium
176mg
366mg
45%
Selenium
27.9µg
5.2µg
41%
Monounsaturated fat
0.229g
14.04g
35%
Fats
1.23g
22.27g
32%
Zinc
2.28mg
4.8mg
23%
Vitamin E
0.21mg
3.33mg
21%
Vitamin B3
1.174mg
4.579mg
21%
Fiber
15.5g
10.5g
20%
Polyunsaturated fat
0.407g
3.279g
19%
Vitamin B5
0.785mg
16%
Starch
34.17g
14%
Phosphorus
411mg
499mg
13%
Potassium
1393mg
1788mg
12%
Vitamin B2
0.212mg
0.327mg
9%
Choline
66.2mg
24.7mg
8%
Protein
21.42g
17.81g
7%
Sodium
12mg
168mg
7%
Vitamin A
0µg
64µg
7%
Vitamin B1
0.713mg
0.628mg
7%
Carbs
62.55g
44.24g
6%
Saturated fat
0.235g
1.535g
6%
Copper
0.893mg
0.867mg
3%
Vitamin B6
0.474mg
0.435mg
3%
Vitamin C
6.3mg
7.7mg
2%
Calories
347kcal
375kcal
1%
Protein per 100 calories
6.2g
4.7g
N/A
Calories per 10 g protein
162kcal
211kcal
N/A
Weight per 100 calories
29g
27g
N/A
Unsaturated / Saturated Fat ratio
2.7
11
N/A
Net carbs
47.05g
33.74g
N/A
Sugar
2.11g
2.25g
N/A
Vitamin K
5.6µg
5.4µg
0%
Tryptophan
0.237mg
0%
Threonine
0.81mg
0%
Isoleucine
0.871mg
0%
Leucine
1.558mg
0%
Lysine
1.356mg
0%
Methionine
0.259mg
0%
Phenylalanine
1.095mg
0%
Valine
0.998mg
0%
Histidine
0.556mg
0%
Macronutrient Comparison
Macronutrient breakdown side-by-side comparison
3
21%
63%
11%
3%
Protein:
21.42 g
Fats:
1.23 g
Carbs:
62.55 g
Water:
11.33 g
Other:
3.47 g
2
18%
22%
44%
8%
8%
Protein:
17.81 g
Fats:
22.27 g
Carbs:
44.24 g
Water:
8.06 g
Other:
7.62 g
Contains
more
Protein Protein
+20.3%
Contains
more
Carbs Carbs
+41.4%
Contains
more
Water Water
+40.6%
Contains
more
Fats Fats
+1710.6%
Contains
more
Other Other
+119.6%
Fat Type Comparison
Fat type breakdown side-by-side comparison
1
27%
26%
47%
Saturated fat:
Sat. Fat
0.235 g
Monounsaturated fat:
Mono. Fat
0.229 g
Polyunsaturated fat:
Poly. Fat
0.407 g
2
8%
74%
17%
Saturated fat:
Sat. Fat
1.535 g
Monounsaturated fat:
Mono. Fat
14.04 g
Polyunsaturated fat:
Poly. Fat
3.279 g
Contains
less
Sat. Fat Saturated fat
-84.7%
Contains
more
Mono. Fat Monounsaturated fat
+6031%
Contains
more
Poly. Fat Polyunsaturated fat
+705.7%