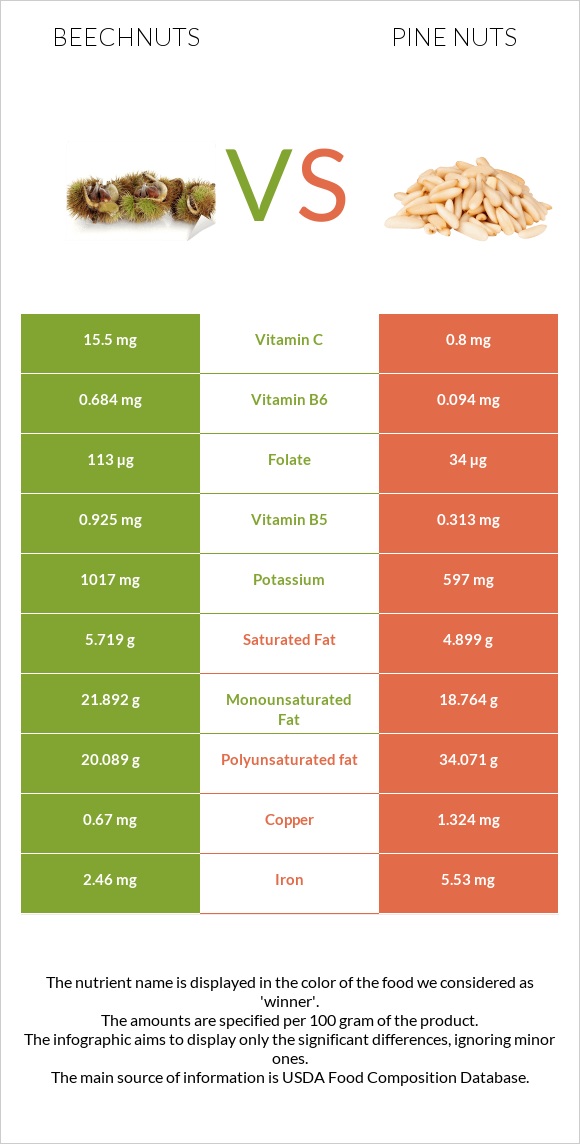
The main differences between beechnuts and pine nuts Beechnuts are richer in vitamin B6, folate, and vitamin C, yet pine nuts are richer in manganese, phosphorus, copper, magnesium, zinc, iron, and vitamin B3. Daily need coverage for manganese for pine nuts is 324% higher. Beechnuts contain 19 times more vitamin C than pine nuts. Beechnuts contain 15.5mg of vitamin C, while pine nuts contain 0.8mg. Food types used in this article are Nuts, beechnuts, dried and Nuts, pine nuts, dried .
Infographic
Mineral Comparison
Mineral comparison score is based on the number of minerals by which one or the other food is richer. The "coverage" charts below show how much of the daily needs can be covered by 300 grams of the food.
1
100 g
300 g
1 oz - 28.35g
Magnesium
Magnesium
Calcium
Calcium
Potassium
Potassium
Iron
Iron
Copper
Copper
Zinc
Zinc
Phosphorus
Phosphorus
Sodium
Sodium
Manganese
Manganese
Selenium
Selenium
0%
0.3%
90%
92%
223%
9.8%
0%
5%
175%
0%
9
100 g
300 g
10 nuts - 1.7g 1 oz (167 kernels) - 28.35g 1 cup - 135g
Magnesium
Magnesium
Calcium
Calcium
Potassium
Potassium
Iron
Iron
Copper
Copper
Zinc
Zinc
Phosphorus
Phosphorus
Sodium
Sodium
Manganese
Manganese
Selenium
Selenium
179%
4.8%
53%
207%
441%
176%
246%
0.26%
1148%
3.8%
Vitamin Comparison
Vitamin comparison score is based on the number of vitamins by which one or the other food is richer. The "coverage" charts below show how much of the daily needs can be covered by 300 grams of the food.
5
100 g
300 g
1 oz - 28.35g
Vitamin C
Vit. C
Vitamin D
Vit. D
Vitamin A
Vit. A
Vitamin E
Vit. E
Vitamin B1
Vit. B1
Vitamin B2
Vit. B2
Vitamin B3
Vit. B3
Vitamin B5
Vit. B5
Vitamin B6
Vit. B6
Vitamin B12
Vit. B12
Vitamin K
Vit. K
Folate
Folate
52%
0%
0%
0%
76%
86%
16%
56%
158%
0%
0%
85%
5
100 g
300 g
10 nuts - 1.7g 1 oz (167 kernels) - 28.35g 1 cup - 135g
Vitamin C
Vit. C
Vitamin D
Vit. D
Vitamin A
Vit. A
Vitamin E
Vit. E
Vitamin B1
Vit. B1
Vitamin B2
Vit. B2
Vitamin B3
Vit. B3
Vitamin B5
Vit. B5
Vitamin B6
Vit. B6
Vitamin B12
Vit. B12
Vitamin K
Vit. K
Folate
Folate
2.7%
0%
0.33%
187%
91%
52%
82%
19%
22%
0%
135%
26%
All nutrients comparison - raw data values
Nutrient
DV% diff.
Manganese
1.341mg
8.802mg
324%
Polyunsaturated fat
20.089g
34.071g
93%
Phosphorus
0mg
575mg
82%
Copper
0.67mg
1.324mg
73%
Vitamin E
9.33mg
62%
Magnesium
0mg
251mg
60%
Zinc
0.36mg
6.45mg
55%
Vitamin B6
0.684mg
0.094mg
45%
Vitamin K
53.9µg
45%
Iron
2.46mg
5.53mg
38%
Fats
50g
68.37g
28%
Vitamin B3
0.877mg
4.387mg
22%
Folate
113µg
34µg
20%
Vitamin C
15.5mg
0.8mg
16%
Protein
6.2g
13.69g
15%
Fiber
3.7g
15%
Potassium
1017mg
597mg
12%
Vitamin B5
0.925mg
0.313mg
12%
Vitamin B2
0.371mg
0.227mg
11%
Choline
55.8mg
10%
Monounsaturated fat
21.892g
18.764g
8%
Carbs
33.5g
13.08g
7%
Calories
576kcal
673kcal
5%
Vitamin B1
0.304mg
0.364mg
5%
Saturated fat
5.719g
4.899g
4%
Calcium
1mg
16mg
2%
Sodium
38mg
2mg
2%
Starch
1.43g
1%
Selenium
0.7µg
1%
Protein per 100 calories
1.1g
2g
N/A
Calories per 10 g protein
929kcal
492kcal
N/A
Weight per 100 calories
17g
15g
N/A
Unsaturated / Saturated Fat ratio
7.3
11
N/A
Net carbs
33.5g
9.38g
N/A
Sugar
3.59g
N/A
Vitamin A
0µg
1µg
0%
Tryptophan
0.069mg
0.107mg
0%
Threonine
0.221mg
0.37mg
0%
Isoleucine
0.245mg
0.542mg
0%
Leucine
0.367mg
0.991mg
0%
Lysine
0.367mg
0.54mg
0%
Methionine
0.146mg
0.259mg
0%
Phenylalanine
0.262mg
0.524mg
0%
Valine
0.346mg
0.687mg
0%
Histidine
0.172mg
0.341mg
0%
Fructose
0.07g
0%
Omega-3 - ALA
0.112g
N/A
Omega-6 - Gamma-linoleic acid
0.052g
N/A
Omega-6 - Eicosadienoic acid
0.404g
N/A
Macronutrient Comparison
Macronutrient breakdown side-by-side comparison
3
6%
50%
34%
7%
4%
Protein:
6.2 g
Fats:
50 g
Carbs:
33.5 g
Water:
6.6 g
Other:
3.7 g
2
14%
68%
13%
2%
3%
Protein:
13.69 g
Fats:
68.37 g
Carbs:
13.08 g
Water:
2.28 g
Other:
2.58 g
Contains
more
Carbs Carbs
+156.1%
Contains
more
Water Water
+189.5%
Contains
more
Other Other
+43.4%
Contains
more
Protein Protein
+120.8%
Contains
more
Fats Fats
+36.7%
Fat Type Comparison
Fat type breakdown side-by-side comparison
1
12%
46%
42%
Saturated fat:
Sat. Fat
5.719 g
Monounsaturated fat:
Mono. Fat
21.892 g
Polyunsaturated fat:
Poly. Fat
20.089 g
2
8%
33%
59%
Saturated fat:
Sat. Fat
4.899 g
Monounsaturated fat:
Mono. Fat
18.764 g
Polyunsaturated fat:
Poly. Fat
34.071 g
Contains
more
Mono. Fat Monounsaturated fat
+16.7%
Contains
less
Sat. Fat Saturated fat
-14.3%
Contains
more
Poly. Fat Polyunsaturated fat
+69.6%