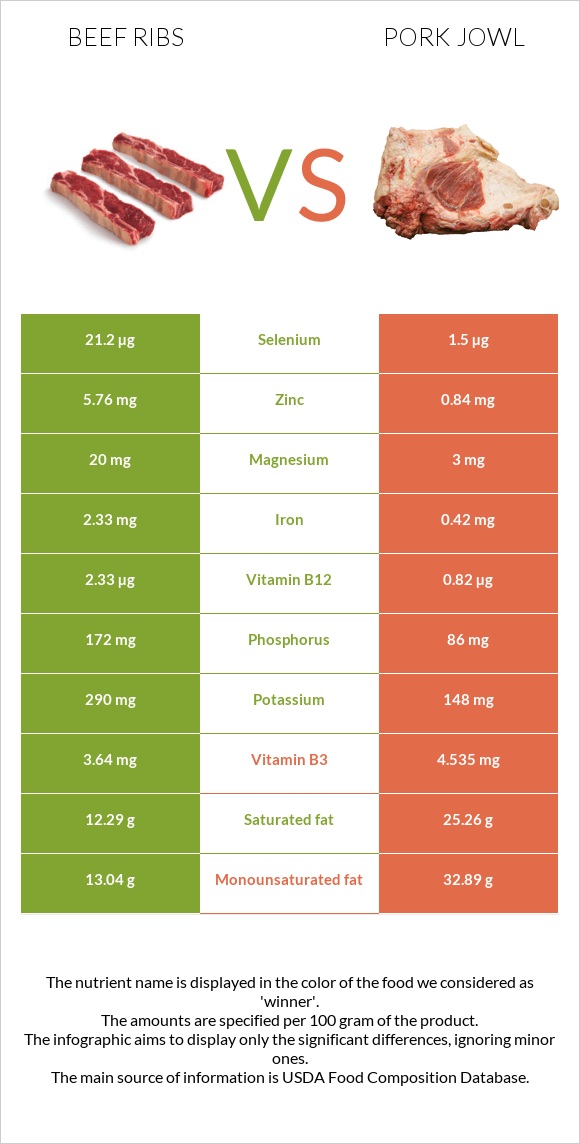
Differences between beef ribs and pork jowl Beef ribs have more vitamin B12, zinc, selenium, iron, phosphorus, vitamin B6, and copper, while pork jowl has more vitamin B1 and vitamin B3. Pork jowl's daily need coverage for saturated fat is 65% higher. Pork jowl contains 14 times less selenium than beef ribs. Beef ribs contain 21.2µg of selenium, while pork jowl contains 1.5µg. The amount of saturated fat in beef ribs is lower. The food types used in this comparison are Beef, rib, large end (ribs 6-9), separable lean, and fat, trimmed to 0" fat, choice, cooked, roasted and Pork, fresh, variety meats, and by-products, jowl, raw .
Infographic
Mineral Comparison
Mineral comparison score is based on the number of minerals by which one or the other food is richer. The "coverage" charts below show how much of the daily needs can be covered by 300 grams of the food.
9
100 g
300 g
3 oz - 85g 1 piece, cooked, excluding refuse (yield from 1 lb raw meat with refuse) - 290g
Magnesium
Magnesium
Calcium
Calcium
Potassium
Potassium
Iron
Iron
Copper
Copper
Zinc
Zinc
Phosphorus
Phosphorus
Sodium
Sodium
Manganese
Manganese
Selenium
Selenium
14%
3%
26%
87%
29%
157%
74%
8.3%
1.7%
116%
1
100 g
300 g
1 oz - 28.35g 4 oz - 113g
Magnesium
Magnesium
Calcium
Calcium
Potassium
Potassium
Iron
Iron
Copper
Copper
Zinc
Zinc
Phosphorus
Phosphorus
Sodium
Sodium
Manganese
Manganese
Selenium
Selenium
2.1%
1.2%
13%
16%
13%
23%
37%
3.3%
0.65%
8.2%
Vitamin Comparison
Vitamin comparison score is based on the number of vitamins by which one or the other food is richer. The "coverage" charts below show how much of the daily needs can be covered by 300 grams of the food.
4
100 g
300 g
3 oz - 85g 1 piece, cooked, excluding refuse (yield from 1 lb raw meat with refuse) - 290g
Vitamin C
Vit. C
Vitamin D
Vit. D
Vitamin A
Vit. A
Vitamin E
Vit. E
Vitamin B1
Vit. B1
Vitamin B2
Vit. B2
Vitamin B3
Vit. B3
Vitamin B5
Vit. B5
Vitamin B6
Vit. B6
Vitamin B12
Vit. B12
Vitamin K
Vit. K
Folate
Folate
0%
0%
0%
0%
18%
44%
68%
22%
53%
291%
0%
5.3%
5
100 g
300 g
1 oz - 28.35g 4 oz - 113g
Vitamin C
Vit. C
Vitamin D
Vit. D
Vitamin A
Vit. A
Vitamin E
Vit. E
Vitamin B1
Vit. B1
Vitamin B2
Vit. B2
Vitamin B3
Vit. B3
Vitamin B5
Vit. B5
Vitamin B6
Vit. B6
Vitamin B12
Vit. B12
Vitamin K
Vit. K
Folate
Folate
0%
0%
1%
5.8%
97%
54%
85%
15%
21%
103%
0%
0.75%
All nutrients comparison - raw data values
Nutrient
DV% diff.
Vitamin B12
2.33µg
0.82µg
63%
Fats
30.49g
69.61g
60%
Saturated fat
12.29g
25.26g
59%
Monounsaturated fat
13.04g
32.89g
50%
Polyunsaturated fat
1.05g
8.11g
47%
Zinc
5.76mg
0.84mg
45%
Selenium
21.2µg
1.5µg
36%
Protein
22.8g
6.38g
33%
Vitamin B1
0.07mg
0.386mg
26%
Iron
2.33mg
0.42mg
24%
Calories
372kcal
655kcal
14%
Phosphorus
172mg
86mg
12%
Vitamin B6
0.23mg
0.09mg
11%
Vitamin B3
3.64mg
4.535mg
6%
Copper
0.088mg
0.04mg
5%
Magnesium
20mg
3mg
4%
Potassium
290mg
148mg
4%
Vitamin B2
0.19mg
0.236mg
4%
Cholesterol
85mg
90mg
2%
Sodium
64mg
25mg
2%
Vitamin E
0.29mg
2%
Vitamin B5
0.37mg
0.25mg
2%
Folate
7µg
1µg
2%
Calcium
10mg
4mg
1%
Protein per 100 calories
6.1g
0.97g
N/A
Calories per 10 g protein
163kcal
1027kcal
N/A
Weight per 100 calories
27g
15g
N/A
Unsaturated / Saturated Fat ratio
1.1
1.6
N/A
Vitamin A
0µg
3µg
0%
Manganese
0.013mg
0.005mg
0%
Tryptophan
0.255mg
0.021mg
0%
Threonine
0.996mg
0.21mg
0%
Isoleucine
1.025mg
0.168mg
0%
Leucine
1.802mg
0.446mg
0%
Lysine
1.897mg
0.528mg
0%
Methionine
0.584mg
0.095mg
0%
Phenylalanine
0.89mg
0.239mg
0%
Valine
1.109mg
0.305mg
0%
Histidine
0.781mg
0.072mg
0%
Macronutrient Comparison
Macronutrient breakdown side-by-side comparison
2
23%
30%
46%
Protein:
22.8 g
Fats:
30.49 g
Carbs:
0 g
Water:
46.1 g
Other:
0.61 g
2
6%
70%
22%
2%
Protein:
6.38 g
Fats:
69.61 g
Carbs:
0 g
Water:
22.19 g
Other:
1.82 g
Contains
more
Protein Protein
+257.4%
Contains
more
Water Water
+107.8%
Contains
more
Fats Fats
+128.3%
Contains
more
Other Other
+198.4%
Fat Type Comparison
Fat type breakdown side-by-side comparison
1
47%
49%
4%
Saturated fat:
Sat. Fat
12.29 g
Monounsaturated fat:
Mono. Fat
13.04 g
Polyunsaturated fat:
Poly. Fat
1.05 g
2
38%
50%
12%
Saturated fat:
Sat. Fat
25.26 g
Monounsaturated fat:
Mono. Fat
32.89 g
Polyunsaturated fat:
Poly. Fat
8.11 g
Contains
less
Sat. Fat Saturated fat
-51.3%
Contains
more
Mono. Fat Monounsaturated fat
+152.2%
Contains
more
Poly. Fat Polyunsaturated fat
+672.4%