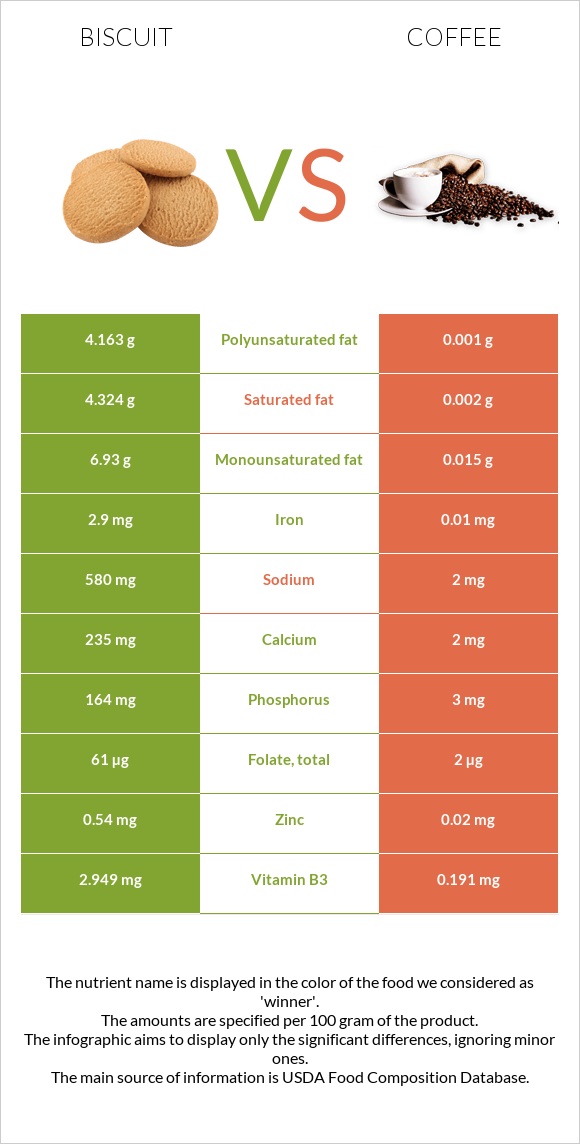
A recap on the differences between biscuits and coffee Biscuits are higher than coffee in iron, selenium, vitamin B1, calcium, phosphorus, vitamin B2, vitamin B3, and manganese. Biscuits cover your daily iron needs 36% more than coffee. The amount of saturated fat in coffee is lower. The glycemic index of coffee is lower. Food varieties used in this article are Biscuits, plain or buttermilk, prepared from recipe and Beverages, coffee, brewed, prepared with tap water .
Infographic
Mineral Comparison
Mineral comparison score is based on the number of minerals by which one or the other food is richer. The "coverage" charts below show how much of the daily needs can be covered by 300 grams of the food.
9
100 g
300 g
1 small (1-1/2" dia) - 14g 1 oz - 28.35g 1 biscuit (2-1/2" dia) - 60g 1 biscuit (4" dia) - 101g
Magnesium
Magnesium
Calcium
Calcium
Potassium
Potassium
Iron
Iron
Copper
Copper
Zinc
Zinc
Phosphorus
Phosphorus
Sodium
Sodium
Manganese
Manganese
Selenium
Selenium
13%
71%
11%
109%
27%
15%
70%
76%
49%
106%
1
100 g
300 g
1 fl oz - 29.6g 6 fl oz - 178g 1 cup (8 fl oz) - 237g
Magnesium
Magnesium
Calcium
Calcium
Potassium
Potassium
Iron
Iron
Copper
Copper
Zinc
Zinc
Phosphorus
Phosphorus
Sodium
Sodium
Manganese
Manganese
Selenium
Selenium
2.1%
0.6%
4.3%
0.38%
0.67%
0.55%
1.3%
0.26%
3%
0%
Vitamin Comparison
Vitamin comparison score is based on the number of vitamins by which one or the other food is richer. The "coverage" charts below show how much of the daily needs can be covered by 300 grams of the food.
8
100 g
300 g
1 small (1-1/2" dia) - 14g 1 oz - 28.35g 1 biscuit (2-1/2" dia) - 60g 1 biscuit (4" dia) - 101g
Vitamin C
Vit. C
Vitamin D
Vit. D
Vitamin A
Vit. A
Vitamin E
Vit. E
Vitamin B1
Vit. B1
Vitamin B2
Vit. B2
Vitamin B3
Vit. B3
Vitamin B5
Vit. B5
Vitamin B6
Vit. B6
Vitamin B12
Vit. B12
Vitamin K
Vit. K
Folate
Folate
0.67%
0%
0%
0%
89%
72%
55%
17%
8.1%
10%
0%
46%
2
100 g
300 g
1 fl oz - 29.6g 6 fl oz - 178g 1 cup (8 fl oz) - 237g
Vitamin C
Vit. C
Vitamin D
Vit. D
Vitamin A
Vit. A
Vitamin E
Vit. E
Vitamin B1
Vit. B1
Vitamin B2
Vit. B2
Vitamin B3
Vit. B3
Vitamin B5
Vit. B5
Vitamin B6
Vit. B6
Vitamin B12
Vit. B12
Vitamin K
Vit. K
Folate
Folate
0%
0%
0%
0.2%
3.5%
18%
3.6%
15%
0.23%
0%
0.25%
1.5%
All nutrients comparison - raw data values
Nutrient
DV% diff.
Iron
2.9mg
0.01mg
36%
Selenium
19.5µg
0µg
35%
Vitamin B1
0.356mg
0.014mg
29%
Polyunsaturated fat
4.163g
0.001g
28%
Fats
16.3g
0.02g
25%
Sodium
580mg
2mg
25%
Calcium
235mg
2mg
23%
Phosphorus
164mg
3mg
23%
Saturated fat
4.324g
0.002g
20%
Calories
353kcal
1kcal
18%
Vitamin B2
0.31mg
0.076mg
18%
Vitamin B3
2.949mg
0.191mg
17%
Monounsaturated fat
6.93g
0.015g
17%
Carbs
44.6g
0g
15%
Manganese
0.378mg
0.023mg
15%
Folate
61µg
2µg
15%
Protein
7g
0.12g
14%
Caffeine
40mg
10%
Copper
0.082mg
0.002mg
9%
Fiber
1.5g
0g
6%
Zinc
0.54mg
0.02mg
5%
Magnesium
18mg
3mg
4%
Vitamin B6
0.035mg
0.001mg
3%
Vitamin B12
0.08µg
0µg
3%
Potassium
121mg
49mg
2%
Cholesterol
3mg
0mg
1%
Vitamin B5
0.285mg
0.254mg
1%
Protein per 100 calories
2g
12g
N/A
Calories per 10 g protein
504kcal
83kcal
N/A
Weight per 100 calories
28g
10000g
N/A
Unsaturated / Saturated Fat ratio
2.6
8
N/A
Vitamin C
0.2mg
0mg
0%
Net carbs
43.1g
0g
N/A
Sugar
2.18g
0g
N/A
Vitamin E
0.01mg
0%
Vitamin K
0.1µg
0%
Choline
2.6mg
0%
Tryptophan
0.087mg
0mg
0%
Threonine
0.211mg
0.001mg
0%
Isoleucine
0.273mg
0.002mg
0%
Leucine
0.514mg
0.005mg
0%
Lysine
0.226mg
0.001mg
0%
Methionine
0.132mg
0mg
0%
Phenylalanine
0.347mg
0.003mg
0%
Valine
0.313mg
0.003mg
0%
Histidine
0.161mg
0.002mg
0%
Macronutrient Comparison
Macronutrient breakdown side-by-side comparison
4
7%
16%
45%
29%
3%
Protein:
7 g
Fats:
16.3 g
Carbs:
44.6 g
Water:
28.9 g
Other:
3.2 g
1
99%
Protein:
0.12 g
Fats:
0.02 g
Carbs:
0 g
Water:
99.39 g
Other:
0.47 g
Contains
more
Protein Protein
+5733.3%
Contains
more
Fats Fats
+81400%
Contains
more
Carbs Carbs
+∞%
Contains
more
Other Other
+580.9%
Contains
more
Water Water
+243.9%
Fat Type Comparison
Fat type breakdown side-by-side comparison
2
28%
45%
27%
Saturated fat:
Sat. Fat
4.324 g
Monounsaturated fat:
Mono. Fat
6.93 g
Polyunsaturated fat:
Poly. Fat
4.163 g
1
11%
83%
6%
Saturated fat:
Sat. Fat
0.002 g
Monounsaturated fat:
Mono. Fat
0.015 g
Polyunsaturated fat:
Poly. Fat
0.001 g
Contains
more
Mono. Fat Monounsaturated fat
+46100%
Contains
more
Poly. Fat Polyunsaturated fat
+416200%
Contains
less
Sat. Fat Saturated fat
-100%