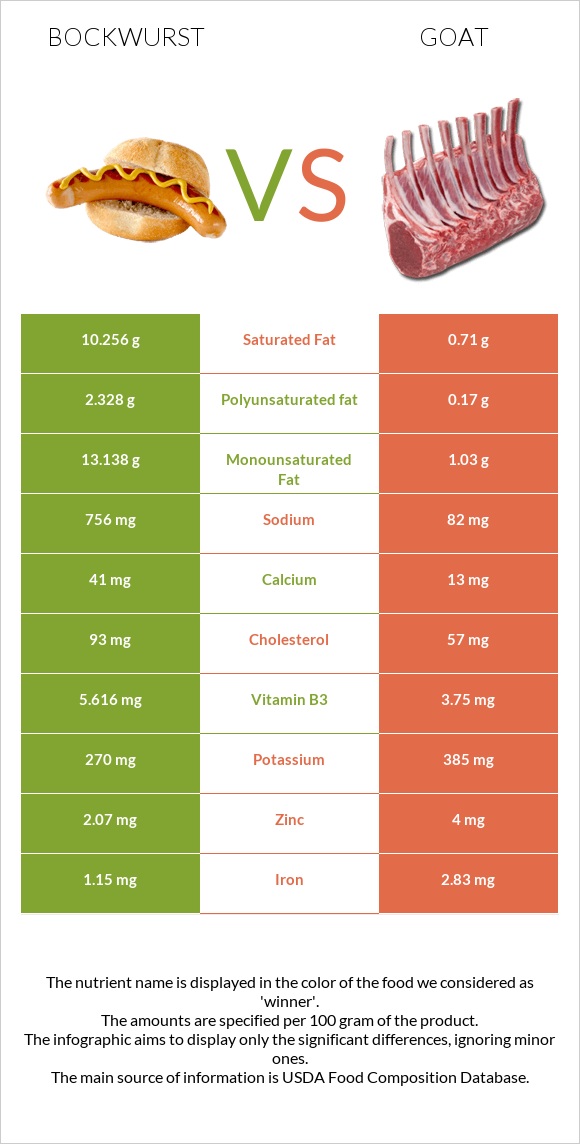
The main differences between bockwurst and goat Bockwurst is richer in vitamin B3 and vitamin B1, yet goat is richer in iron, vitamin B2, zinc, copper, and vitamin B12. Daily need coverage for saturated fat for bockwurst is 48% higher. Bockwurst contains 9 times more sodium than goat. Bockwurst contains 756mg of sodium, while goat contains 82mg. Goat contains less saturated fat. Goat has a lower glycemic index than bockwurst. Food types used in this article are Bockwurst, pork, veal, raw and Goat, raw .
Infographic
Mineral Comparison
Mineral comparison score is based on the number of minerals by which one or the other food is richer. The "coverage" charts below show how much of the daily needs can be covered by 300 grams of the food.
4
100 g
300 g
1 sausage - 91g
Magnesium
Magnesium
Calcium
Calcium
Potassium
Potassium
Iron
Iron
Copper
Copper
Zinc
Zinc
Phosphorus
Phosphorus
Sodium
Sodium
Manganese
Manganese
Selenium
Selenium
19%
12%
24%
43%
33%
56%
72%
99%
22%
62%
5
100 g
300 g
1 oz - 28.35g 1 lb - 453.6g
Magnesium
Magnesium
Calcium
Calcium
Potassium
Potassium
Iron
Iron
Copper
Copper
Zinc
Zinc
Phosphorus
Phosphorus
Sodium
Sodium
Manganese
Manganese
Selenium
Selenium
0%
3.9%
34%
106%
85%
109%
77%
11%
5%
48%
Vitamin Comparison
Vitamin comparison score is based on the number of vitamins by which one or the other food is richer. The "coverage" charts below show how much of the daily needs can be covered by 300 grams of the food.
9
100 g
300 g
1 sausage - 91g
Vitamin C
Vit. C
Vitamin D
Vit. D
Vitamin A
Vit. A
Vitamin E
Vit. E
Vitamin B1
Vit. B1
Vitamin B2
Vit. B2
Vitamin B3
Vit. B3
Vitamin B5
Vit. B5
Vitamin B6
Vit. B6
Vitamin B12
Vit. B12
Vitamin K
Vit. K
Folate
Folate
11%
0%
5%
7.6%
48%
54%
105%
53%
87%
108%
176%
13%
2
100 g
300 g
1 oz - 28.35g 1 lb - 453.6g
Vitamin C
Vit. C
Vitamin D
Vit. D
Vitamin A
Vit. A
Vitamin E
Vit. E
Vitamin B1
Vit. B1
Vitamin B2
Vit. B2
Vitamin B3
Vit. B3
Vitamin B5
Vit. B5
Vitamin B6
Vit. B6
Vitamin B12
Vit. B12
Vitamin K
Vit. K
Folate
Folate
0%
0%
0%
0%
28%
113%
70%
0%
0%
141%
0%
3.8%
All nutrients comparison - raw data values
Nutrient
DV% diff.
Vitamin K
70.2µg
59%
Tryptophan
153mg
0.306mg
55%
Saturated fat
10.256g
0.71g
43%
Fats
25.87g
2.31g
36%
Monounsaturated fat
13.138g
1.03g
30%
Sodium
756mg
82mg
29%
Vitamin B6
0.378mg
29%
Iron
1.15mg
2.83mg
21%
Vitamin B2
0.233mg
0.49mg
20%
Zinc
2.07mg
4mg
18%
Vitamin B5
0.891mg
18%
Copper
0.1mg
0.256mg
17%
Polyunsaturated fat
2.328g
0.17g
14%
Protein
14.03g
20.6g
13%
Cholesterol
93mg
57mg
12%
Vitamin B3
5.616mg
3.75mg
12%
Vitamin B12
0.86µg
1.13µg
11%
Calories
301kcal
109kcal
10%
Choline
46.4mg
8%
Vitamin B1
0.193mg
0.11mg
7%
Magnesium
26mg
6%
Manganese
0.171mg
0.038mg
6%
Selenium
11.3µg
8.8µg
5%
Vitamin C
3.2mg
0mg
4%
Fiber
1g
0g
4%
Calcium
41mg
13mg
3%
Potassium
270mg
385mg
3%
Vitamin E
0.38mg
3%
Folate
17µg
5µg
3%
Phosphorus
169mg
180mg
2%
Vitamin A
15µg
0µg
2%
Carbs
2.95g
0g
1%
Protein per 100 calories
4.7g
19g
N/A
Calories per 10 g protein
215kcal
53kcal
N/A
Weight per 100 calories
33g
92g
N/A
Unsaturated / Saturated Fat ratio
1.5
1.7
N/A
Net carbs
1.95g
0g
N/A
Sugar
1.33g
N/A
Threonine
0.613mg
0.981mg
0%
Isoleucine
0.677mg
1.042mg
0%
Leucine
1.107mg
1.716mg
0%
Lysine
1.166mg
1.532mg
0%
Methionine
0.333mg
0.552mg
0%
Phenylalanine
0.556mg
0.715mg
0%
Valine
0.767mg
1.103mg
0%
Histidine
0.513mg
0.429mg
0%
Fructose
0.01g
0%
Macronutrient Comparison
Macronutrient breakdown side-by-side comparison
3
14%
26%
3%
54%
3%
Protein:
14.03 g
Fats:
25.87 g
Carbs:
2.95 g
Water:
54.47 g
Other:
2.68 g
2
21%
2%
76%
Protein:
20.6 g
Fats:
2.31 g
Carbs:
0 g
Water:
75.84 g
Other:
1.25 g
Contains
more
Fats Fats
+1019.9%
Contains
more
Carbs Carbs
+∞%
Contains
more
Other Other
+114.4%
Contains
more
Protein Protein
+46.8%
Contains
more
Water Water
+39.2%
Fat Type Comparison
Fat type breakdown side-by-side comparison
2
40%
51%
9%
Saturated fat:
Sat. Fat
10.256 g
Monounsaturated fat:
Mono. Fat
13.138 g
Polyunsaturated fat:
Poly. Fat
2.328 g
1
37%
54%
9%
Saturated fat:
Sat. Fat
0.71 g
Monounsaturated fat:
Mono. Fat
1.03 g
Polyunsaturated fat:
Poly. Fat
0.17 g
Contains
more
Mono. Fat Monounsaturated fat
+1175.5%
Contains
more
Poly. Fat Polyunsaturated fat
+1269.4%
Contains
less
Sat. Fat Saturated fat
-93.1%