Significant differences between brie and barley Brie has more vitamin B12; however, barley is richer in manganese, fiber, copper, vitamin B1, selenium, iron, and magnesium. Brie covers your daily saturated fat needs 85% more than barley. Barley contains less cholesterol. Barley has a higher glycemic index. The glycemic index of barley is 28, while the glycemic index of brie is 0. Specific food types used in this comparison are Cheese, brie and Barley, hulled .
Infographic
Mineral Comparison
Mineral comparison score is based on the number of minerals by which one or the other food is richer. The "coverage" charts below show how much of the daily needs can be covered by 300 grams of the food.
1
100 g
300 g
1 cubic inch - 17g 1 oz - 28.35g 1 package (4.5 oz) - 128g 1 cup, sliced - 144g 1 cup, melted - 240g
Magnesium
Magnesium
Calcium
Calcium
Potassium
Potassium
Iron
Iron
Copper
Copper
Zinc
Zinc
Phosphorus
Phosphorus
Sodium
Sodium
Manganese
Manganese
Selenium
Selenium
14%
55%
13%
19%
6.3%
65%
81%
82%
4.4%
79%
9
100 g
300 g
1 cup - 184g
Magnesium
Magnesium
Calcium
Calcium
Potassium
Potassium
Iron
Iron
Copper
Copper
Zinc
Zinc
Phosphorus
Phosphorus
Sodium
Sodium
Manganese
Manganese
Selenium
Selenium
95%
9.9%
40%
135%
166%
76%
113%
1.6%
253%
206%
Vitamin Comparison
Vitamin comparison score is based on the number of vitamins by which one or the other food is richer. The "coverage" charts below show how much of the daily needs can be covered by 300 grams of the food.
6
100 g
300 g
1 cubic inch - 17g 1 oz - 28.35g 1 package (4.5 oz) - 128g 1 cup, sliced - 144g 1 cup, melted - 240g
Vitamin C
Vit. C
Vitamin D
Vit. D
Vitamin A
Vit. A
Vitamin E
Vit. E
Vitamin B1
Vit. B1
Vitamin B2
Vit. B2
Vitamin B3
Vit. B3
Vitamin B5
Vit. B5
Vitamin B6
Vit. B6
Vitamin B12
Vit. B12
Vitamin K
Vit. K
Folate
Folate
0%
7.5%
58%
4.8%
18%
120%
7.1%
41%
54%
206%
5.8%
49%
4
100 g
300 g
1 cup - 184g
Vitamin C
Vit. C
Vitamin D
Vit. D
Vitamin A
Vit. A
Vitamin E
Vit. E
Vitamin B1
Vit. B1
Vitamin B2
Vit. B2
Vitamin B3
Vit. B3
Vitamin B5
Vit. B5
Vitamin B6
Vit. B6
Vitamin B12
Vit. B12
Vitamin K
Vit. K
Folate
Folate
0%
0%
0.33%
11%
162%
66%
86%
17%
73%
0%
5.5%
14%
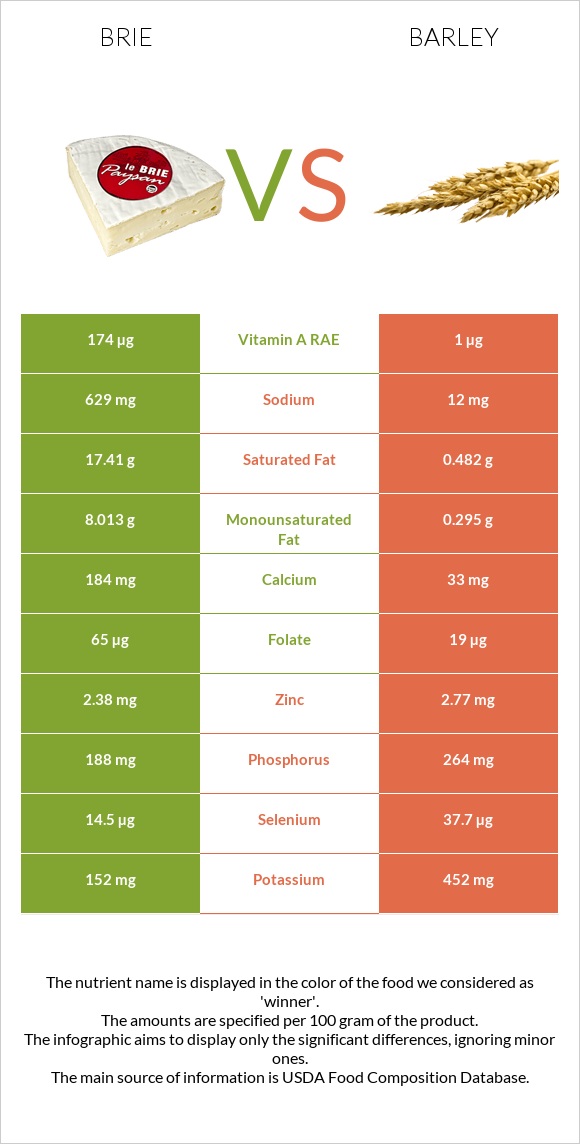
All nutrients comparison - raw data values
Nutrient
DV% diff.
Manganese
0.034mg
1.943mg
83%
Saturated fat
17.41g
0.482g
77%
Fiber
0g
17.3g
69%
Vitamin B12
1.65µg
0µg
69%
Copper
0.019mg
0.498mg
53%
Vitamin B1
0.07mg
0.646mg
48%
Selenium
14.5µg
37.7µg
42%
Fats
27.68g
2.3g
39%
Iron
0.5mg
3.6mg
39%
Cholesterol
100mg
0mg
33%
Magnesium
20mg
133mg
27%
Sodium
629mg
12mg
27%
Vitamin B3
0.38mg
4.604mg
26%
Carbs
0.45g
73.48g
24%
Vitamin A
174µg
1µg
19%
Monounsaturated fat
8.013g
0.295g
19%
Vitamin B2
0.52mg
0.285mg
18%
Protein
20.75g
12.48g
17%
Calcium
184mg
33mg
15%
Folate
65µg
19µg
12%
Phosphorus
188mg
264mg
11%
Potassium
152mg
452mg
9%
Vitamin B5
0.69mg
0.282mg
8%
Vitamin B6
0.235mg
0.318mg
6%
Zinc
2.38mg
2.77mg
4%
Vitamin D*
20 IU
0 IU
3%
Vitamin D
0.5µg
0µg
3%
Choline
15.4mg
3%
Vitamin E
0.24mg
0.57mg
2%
Polyunsaturated fat
0.826g
1.108g
2%
Calories
334kcal
354kcal
1%
Protein per 100 calories
6.2g
3.5g
N/A
Calories per 10 g protein
161kcal
284kcal
N/A
Weight per 100 calories
30g
28g
N/A
Unsaturated / Saturated Fat ratio
0.51
2.9
N/A
Net carbs
0.45g
56.18g
N/A
Sugar
0.45g
0.8g
N/A
Vitamin K
2.3µg
2.2µg
0%
Tryptophan
0.322mg
0.208mg
0%
Threonine
0.751mg
0.424mg
0%
Isoleucine
1.015mg
0.456mg
0%
Leucine
1.929mg
0.848mg
0%
Lysine
1.851mg
0.465mg
0%
Methionine
0.592mg
0.24mg
0%
Phenylalanine
1.158mg
0.7mg
0%
Valine
1.34mg
0.612mg
0%
Histidine
0.716mg
0.281mg
0%
Macronutrient Comparison
Macronutrient breakdown side-by-side comparison
4
21%
28%
48%
3%
Protein:
20.75 g
Fats:
27.68 g
Carbs:
0.45 g
Water:
48.42 g
Other:
2.7 g
1
12%
2%
73%
9%
2%
Protein:
12.48 g
Fats:
2.3 g
Carbs:
73.48 g
Water:
9.44 g
Other:
2.3 g
Contains
more
Protein Protein
+66.3%
Contains
more
Fats Fats
+1103.5%
Contains
more
Water Water
+412.9%
Contains
more
Other Other
+17.4%
Contains
more
Carbs Carbs
+16228.9%
Fat Type Comparison
Fat type breakdown side-by-side comparison
1
66%
31%
3%
Saturated fat:
Sat. Fat
17.41 g
Monounsaturated fat:
Mono. Fat
8.013 g
Polyunsaturated fat:
Poly. Fat
0.826 g
2
26%
16%
59%
Saturated fat:
Sat. Fat
0.482 g
Monounsaturated fat:
Mono. Fat
0.295 g
Polyunsaturated fat:
Poly. Fat
1.108 g
Contains
more
Mono. Fat Monounsaturated fat
+2616.3%
Contains
less
Sat. Fat Saturated fat
-97.2%
Contains
more
Poly. Fat Polyunsaturated fat
+34.1%