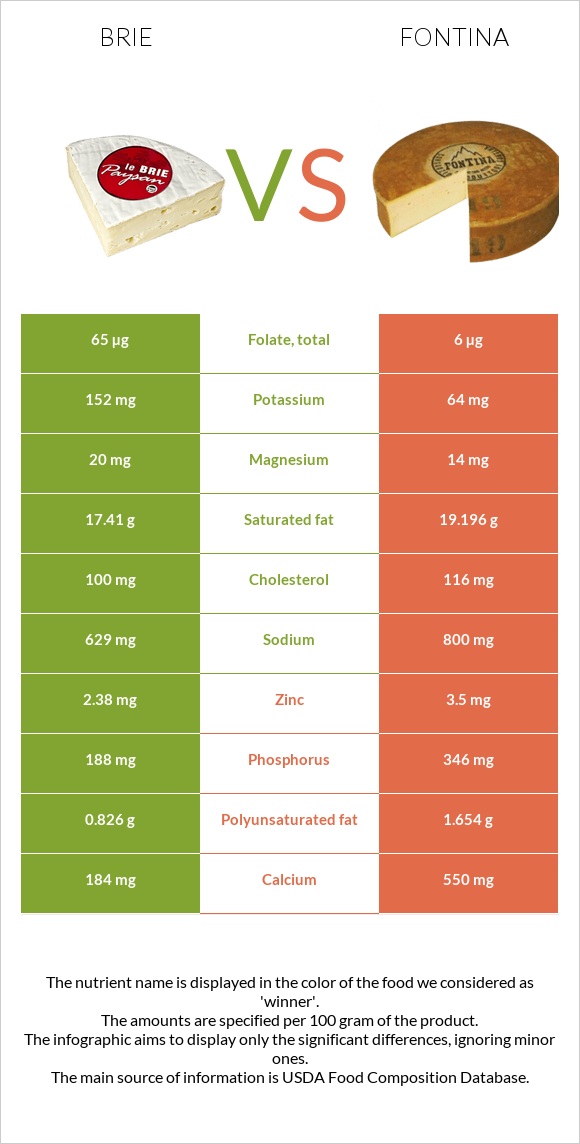
What are the main differences between brie and fontina? Brie is richer in vitamin B2, folate, and vitamin B6, yet fontina is richer in calcium, phosphorus, zinc, and vitamin A. Fontina's daily need coverage for calcium is 37% higher. Brie has 11 times more folate than fontina. Brie has 65µg of folate, while fontina has 6µg. Brie contains less saturated fat. Brie has a lower glycemic index than fontina. We used Cheese, brie and Cheese, fontina types in this comparison.
Infographic
Mineral Comparison
Mineral comparison score is based on the number of minerals by which one or the other food is richer. The "coverage" charts below show how much of the daily needs can be covered by 300 grams of the food.
5
100 g
300 g
1 cubic inch - 17g 1 oz - 28.35g 1 package (4.5 oz) - 128g 1 cup, sliced - 144g 1 cup, melted - 240g
Magnesium
Magnesium
Calcium
Calcium
Potassium
Potassium
Iron
Iron
Copper
Copper
Zinc
Zinc
Phosphorus
Phosphorus
Sodium
Sodium
Manganese
Manganese
Selenium
Selenium
14%
55%
13%
19%
6.3%
65%
81%
82%
4.4%
79%
4
100 g
300 g
1 cubic inch - 15g 1 slice (1 oz) - 28g 1 oz - 28.35g 1 cup, shredded - 108g 1 cup, diced - 132g 1 package (8 oz) - 227g
Magnesium
Magnesium
Calcium
Calcium
Potassium
Potassium
Iron
Iron
Copper
Copper
Zinc
Zinc
Phosphorus
Phosphorus
Sodium
Sodium
Manganese
Manganese
Selenium
Selenium
10%
165%
5.6%
8.6%
8.3%
95%
148%
104%
1.8%
79%
Vitamin Comparison
Vitamin comparison score is based on the number of vitamins by which one or the other food is richer. The "coverage" charts below show how much of the daily needs can be covered by 300 grams of the food.
6
100 g
300 g
1 cubic inch - 17g 1 oz - 28.35g 1 package (4.5 oz) - 128g 1 cup, sliced - 144g 1 cup, melted - 240g
Vitamin C
Vit. C
Vitamin D
Vit. D
Vitamin A
Vit. A
Vitamin E
Vit. E
Vitamin B1
Vit. B1
Vitamin B2
Vit. B2
Vitamin B3
Vit. B3
Vitamin B5
Vit. B5
Vitamin B6
Vit. B6
Vitamin B12
Vit. B12
Vitamin K
Vit. K
Folate
Folate
0%
7.5%
58%
4.8%
18%
120%
7.1%
41%
54%
206%
5.8%
49%
4
100 g
300 g
1 cubic inch - 15g 1 slice (1 oz) - 28g 1 oz - 28.35g 1 cup, shredded - 108g 1 cup, diced - 132g 1 package (8 oz) - 227g
Vitamin C
Vit. C
Vitamin D
Vit. D
Vitamin A
Vit. A
Vitamin E
Vit. E
Vitamin B1
Vit. B1
Vitamin B2
Vit. B2
Vitamin B3
Vit. B3
Vitamin B5
Vit. B5
Vitamin B6
Vit. B6
Vitamin B12
Vit. B12
Vitamin K
Vit. K
Folate
Folate
0%
9%
87%
5.4%
5.3%
47%
2.8%
26%
19%
210%
6.5%
4.5%
All nutrients comparison - raw data values
Nutrient
DV% diff.
Calcium
184mg
550mg
37%
Vitamin B2
0.52mg
0.204mg
24%
Phosphorus
188mg
346mg
23%
Folate
65µg
6µg
15%
Vitamin B6
0.235mg
0.083mg
12%
Protein
20.75g
25.6g
10%
Zinc
2.38mg
3.5mg
10%
Vitamin A
174µg
261µg
10%
Saturated fat
17.41g
19.196g
8%
Sodium
629mg
800mg
7%
Polyunsaturated fat
0.826g
1.654g
6%
Fats
27.68g
31.14g
5%
Cholesterol
100mg
116mg
5%
Vitamin B5
0.69mg
0.429mg
5%
Vitamin B1
0.07mg
0.021mg
4%
Calories
334kcal
389kcal
3%
Potassium
152mg
64mg
3%
Iron
0.5mg
0.23mg
3%
Monounsaturated fat
8.013g
8.687g
2%
Vitamin D
0.5µg
0.6µg
1%
Magnesium
20mg
14mg
1%
Copper
0.019mg
0.025mg
1%
Manganese
0.034mg
0.014mg
1%
Vitamin B3
0.38mg
0.15mg
1%
Vitamin B12
1.65µg
1.68µg
1%
Protein per 100 calories
6.2g
6.6g
N/A
Calories per 10 g protein
161kcal
152kcal
N/A
Weight per 100 calories
30g
26g
N/A
Unsaturated / Saturated Fat ratio
0.51
0.54
N/A
Net carbs
0.45g
1.55g
N/A
Carbs
0.45g
1.55g
0%
Vitamin D*
20 IU
23 IU
0%
Sugar
0.45g
1.55g
N/A
Vitamin E
0.24mg
0.27mg
0%
Selenium
14.5µg
14.5µg
0%
Vitamin K
2.3µg
2.6µg
0%
Choline
15.4mg
15.4mg
0%
Tryptophan
0.322mg
0.361mg
0%
Threonine
0.751mg
0.935mg
0%
Isoleucine
1.015mg
1.384mg
0%
Leucine
1.929mg
2.664mg
0%
Lysine
1.851mg
2.328mg
0%
Methionine
0.592mg
0.706mg
0%
Phenylalanine
1.158mg
1.497mg
0%
Valine
1.34mg
1.926mg
0%
Histidine
0.716mg
0.959mg
0%
Macronutrient Comparison
Macronutrient breakdown side-by-side comparison
1
21%
28%
48%
3%
Protein:
20.75 g
Fats:
27.68 g
Carbs:
0.45 g
Water:
48.42 g
Other:
2.7 g
4
26%
31%
38%
4%
Protein:
25.6 g
Fats:
31.14 g
Carbs:
1.55 g
Water:
37.92 g
Other:
3.79 g
Contains
more
Water Water
+27.7%
Contains
more
Protein Protein
+23.4%
Contains
more
Fats Fats
+12.5%
Contains
more
Carbs Carbs
+244.4%
Contains
more
Other Other
+40.4%
Fat Type Comparison
Fat type breakdown side-by-side comparison
1
66%
31%
3%
Saturated fat:
Sat. Fat
17.41 g
Monounsaturated fat:
Mono. Fat
8.013 g
Polyunsaturated fat:
Poly. Fat
0.826 g
2
65%
29%
6%
Saturated fat:
Sat. Fat
19.196 g
Monounsaturated fat:
Mono. Fat
8.687 g
Polyunsaturated fat:
Poly. Fat
1.654 g
Contains
less
Sat. Fat Saturated fat
-9.3%
Contains
more
Poly. Fat Polyunsaturated fat
+100.2%
~equal in
Monounsaturated fat
~8.687g