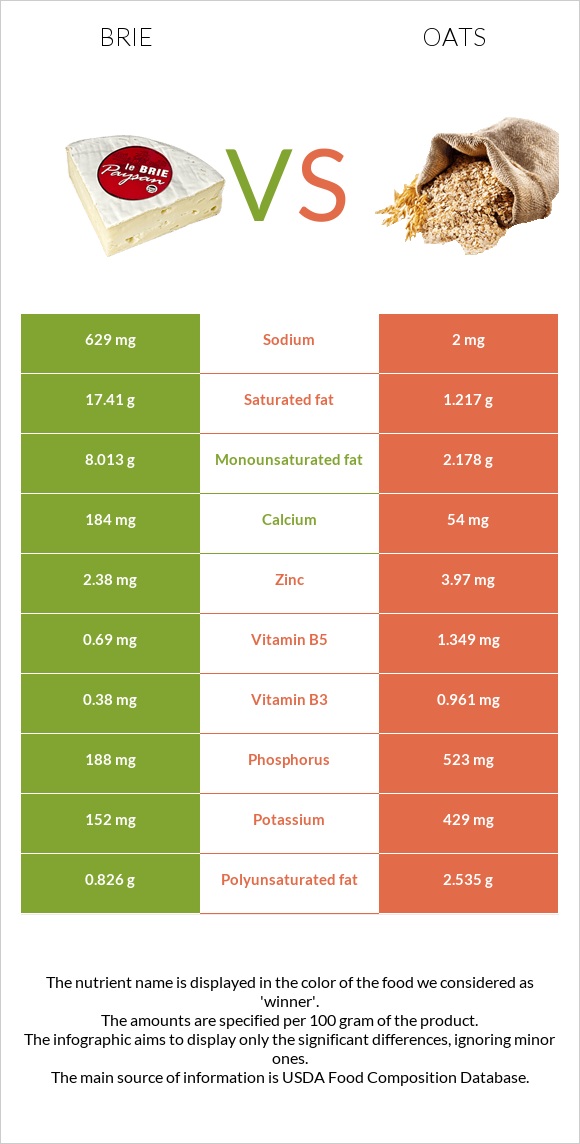
The main differences between brie and oats Brie is richer in vitamin B12, yet oats are richer in manganese, copper, vitamin B1, iron, phosphorus, fiber, and magnesium. Daily need coverage for manganese for oats is 212% higher. Oats contain less cholesterol. Brie has a lower glycemic index than oats. Food types used in this article are Cheese, brie and Oats .
Infographic
Mineral Comparison
Mineral comparison score is based on the number of minerals by which one or the other food is richer. The "coverage" charts below show how much of the daily needs can be covered by 300 grams of the food.
2
100 g
300 g
1 cubic inch - 17g 1 oz - 28.35g 1 package (4.5 oz) - 128g 1 cup, sliced - 144g 1 cup, melted - 240g
Magnesium
Magnesium
Calcium
Calcium
Potassium
Potassium
Iron
Iron
Copper
Copper
Zinc
Zinc
Phosphorus
Phosphorus
Sodium
Sodium
Manganese
Manganese
Selenium
Selenium
14%
55%
13%
19%
6.3%
65%
81%
82%
4.4%
79%
8
100 g
300 g
1 cup - 156g
Magnesium
Magnesium
Calcium
Calcium
Potassium
Potassium
Iron
Iron
Copper
Copper
Zinc
Zinc
Phosphorus
Phosphorus
Sodium
Sodium
Manganese
Manganese
Selenium
Selenium
126%
16%
38%
177%
209%
108%
224%
0.26%
641%
0%
Vitamin Comparison
Vitamin comparison score is based on the number of vitamins by which one or the other food is richer. The "coverage" charts below show how much of the daily needs can be covered by 300 grams of the food.
8
100 g
300 g
1 cubic inch - 17g 1 oz - 28.35g 1 package (4.5 oz) - 128g 1 cup, sliced - 144g 1 cup, melted - 240g
Vitamin C
Vit. C
Vitamin D
Vit. D
Vitamin A
Vit. A
Vitamin E
Vit. E
Vitamin B1
Vit. B1
Vitamin B2
Vit. B2
Vitamin B3
Vit. B3
Vitamin B5
Vit. B5
Vitamin B6
Vit. B6
Vitamin B12
Vit. B12
Vitamin K
Vit. K
Folate
Folate
0%
7.5%
58%
4.8%
18%
120%
7.1%
41%
54%
206%
5.8%
49%
3
100 g
300 g
1 cup - 156g
Vitamin C
Vit. C
Vitamin D
Vit. D
Vitamin A
Vit. A
Vitamin E
Vit. E
Vitamin B1
Vit. B1
Vitamin B2
Vit. B2
Vitamin B3
Vit. B3
Vitamin B5
Vit. B5
Vitamin B6
Vit. B6
Vitamin B12
Vit. B12
Vitamin K
Vit. K
Folate
Folate
0%
0%
0%
0%
191%
32%
18%
81%
27%
0%
0%
42%
All nutrients comparison - raw data values
Nutrient
DV% diff.
Manganese
0.034mg
4.916mg
212%
Saturated fat
17.41g
1.217g
74%
Vitamin B12
1.65µg
0µg
69%
Copper
0.019mg
0.626mg
67%
Vitamin B1
0.07mg
0.763mg
58%
Iron
0.5mg
4.72mg
53%
Phosphorus
188mg
523mg
48%
Fiber
0g
10.6g
42%
Magnesium
20mg
177mg
37%
Cholesterol
100mg
0mg
33%
Fats
27.68g
6.9g
32%
Vitamin B2
0.52mg
0.139mg
29%
Sodium
629mg
2mg
27%
Selenium
14.5µg
26%
Carbs
0.45g
66.27g
22%
Vitamin A
174µg
0µg
19%
Monounsaturated fat
8.013g
2.178g
15%
Zinc
2.38mg
3.97mg
14%
Calcium
184mg
54mg
13%
Vitamin B5
0.69mg
1.349mg
13%
Polyunsaturated fat
0.826g
2.535g
11%
Vitamin B6
0.235mg
0.119mg
9%
Protein
20.75g
16.89g
8%
Potassium
152mg
429mg
8%
Vitamin B3
0.38mg
0.961mg
4%
Calories
334kcal
389kcal
3%
Vitamin D*
20 IU
0 IU
3%
Vitamin D
0.5µg
0µg
3%
Choline
15.4mg
3%
Vitamin E
0.24mg
2%
Vitamin K
2.3µg
2%
Folate
65µg
56µg
2%
Protein per 100 calories
6.2g
4.3g
N/A
Calories per 10 g protein
161kcal
230kcal
N/A
Weight per 100 calories
30g
26g
N/A
Unsaturated / Saturated Fat ratio
0.51
3.9
N/A
Net carbs
0.45g
55.67g
N/A
Sugar
0.45g
N/A
Tryptophan
0.322mg
0.234mg
0%
Threonine
0.751mg
0.575mg
0%
Isoleucine
1.015mg
0.694mg
0%
Leucine
1.929mg
1.284mg
0%
Lysine
1.851mg
0.701mg
0%
Methionine
0.592mg
0.312mg
0%
Phenylalanine
1.158mg
0.895mg
0%
Valine
1.34mg
0.937mg
0%
Histidine
0.716mg
0.405mg
0%
Macronutrient Comparison
Macronutrient breakdown side-by-side comparison
4
21%
28%
48%
3%
Protein:
20.75 g
Fats:
27.68 g
Carbs:
0.45 g
Water:
48.42 g
Other:
2.7 g
1
17%
7%
66%
8%
2%
Protein:
16.89 g
Fats:
6.9 g
Carbs:
66.27 g
Water:
8.22 g
Other:
1.72 g
Contains
more
Protein Protein
+22.9%
Contains
more
Fats Fats
+301.2%
Contains
more
Water Water
+489.1%
Contains
more
Other Other
+57%
Contains
more
Carbs Carbs
+14626.7%
Fat Type Comparison
Fat type breakdown side-by-side comparison
1
66%
31%
3%
Saturated fat:
Sat. Fat
17.41 g
Monounsaturated fat:
Mono. Fat
8.013 g
Polyunsaturated fat:
Poly. Fat
0.826 g
2
21%
37%
43%
Saturated fat:
Sat. Fat
1.217 g
Monounsaturated fat:
Mono. Fat
2.178 g
Polyunsaturated fat:
Poly. Fat
2.535 g
Contains
more
Mono. Fat Monounsaturated fat
+267.9%
Contains
less
Sat. Fat Saturated fat
-93%
Contains
more
Poly. Fat Polyunsaturated fat
+206.9%