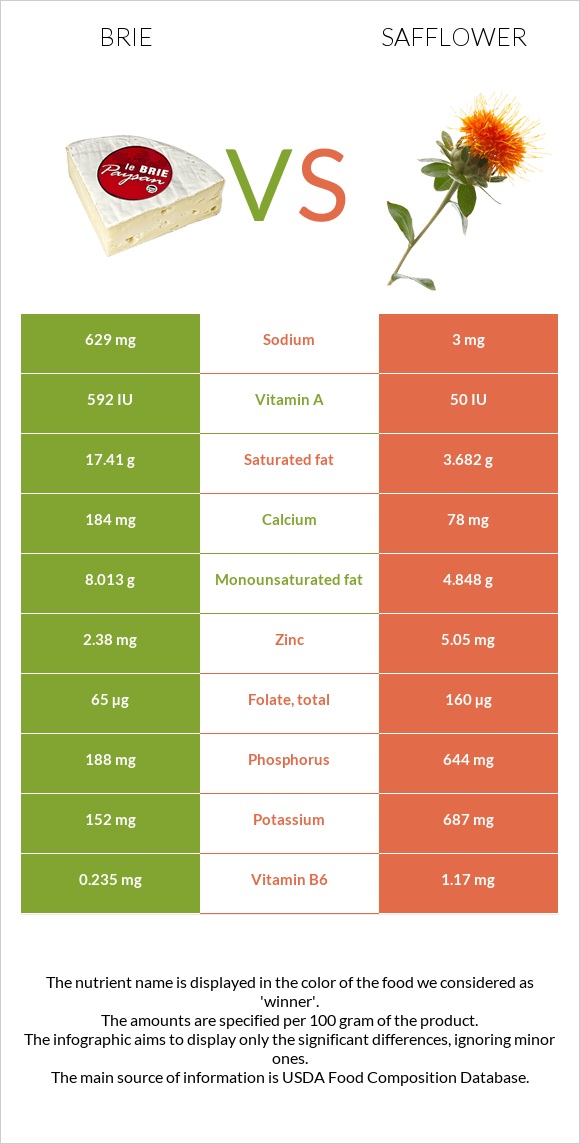
What are the differences between brie and safflower? Brie is higher in vitamin B12, yet safflower is higher in copper, vitamin B1, manganese, magnesium, vitamin B6, vitamin B5, phosphorus, and iron. Safflower's daily need coverage for copper is 192% more. The amount of saturated fat in safflower is lower. We used Cheese, brie and Seeds, safflower seed kernels, dried types in this article.
Infographic
Mineral Comparison
Mineral comparison score is based on the number of minerals by which one or the other food is richer. The "coverage" charts below show how much of the daily needs can be covered by 300 grams of the food.
2
100 g
300 g
1 cubic inch - 17g 1 oz - 28.35g 1 package (4.5 oz) - 128g 1 cup, sliced - 144g 1 cup, melted - 240g
Magnesium
Magnesium
Calcium
Calcium
Potassium
Potassium
Iron
Iron
Copper
Copper
Zinc
Zinc
Phosphorus
Phosphorus
Sodium
Sodium
Manganese
Manganese
Selenium
Selenium
14%
55%
13%
19%
6.3%
65%
81%
82%
4.4%
79%
8
100 g
300 g
1 oz - 28.35g
Magnesium
Magnesium
Calcium
Calcium
Potassium
Potassium
Iron
Iron
Copper
Copper
Zinc
Zinc
Phosphorus
Phosphorus
Sodium
Sodium
Manganese
Manganese
Selenium
Selenium
252%
23%
61%
184%
582%
138%
276%
0.39%
263%
0%
Vitamin Comparison
Vitamin comparison score is based on the number of vitamins by which one or the other food is richer. The "coverage" charts below show how much of the daily needs can be covered by 300 grams of the food.
6
100 g
300 g
1 cubic inch - 17g 1 oz - 28.35g 1 package (4.5 oz) - 128g 1 cup, sliced - 144g 1 cup, melted - 240g
Vitamin C
Vit. C
Vitamin D
Vit. D
Vitamin A
Vit. A
Vitamin E
Vit. E
Vitamin B1
Vit. B1
Vitamin B2
Vit. B2
Vitamin B3
Vit. B3
Vitamin B5
Vit. B5
Vitamin B6
Vit. B6
Vitamin B12
Vit. B12
Vitamin K
Vit. K
Folate
Folate
0%
7.5%
58%
4.8%
18%
120%
7.1%
41%
54%
206%
5.8%
49%
5
100 g
300 g
1 oz - 28.35g
Vitamin C
Vit. C
Vitamin D
Vit. D
Vitamin A
Vit. A
Vitamin E
Vit. E
Vitamin B1
Vit. B1
Vitamin B2
Vit. B2
Vitamin B3
Vit. B3
Vitamin B5
Vit. B5
Vitamin B6
Vit. B6
Vitamin B12
Vit. B12
Vitamin K
Vit. K
Folate
Folate
0%
0%
1%
0%
291%
96%
43%
242%
270%
0%
0%
120%
All nutrients comparison - raw data values
Nutrient
DV% diff.
Copper
0.019mg
1.747mg
192%
Polyunsaturated fat
0.826g
28.223g
183%
Vitamin B1
0.07mg
1.163mg
91%
Manganese
0.034mg
2.014mg
86%
Magnesium
20mg
353mg
79%
Vitamin B6
0.235mg
1.17mg
72%
Vitamin B12
1.65µg
0µg
69%
Vitamin B5
0.69mg
4.03mg
67%
Phosphorus
188mg
644mg
65%
Saturated fat
17.41g
3.682g
62%
Iron
0.5mg
4.9mg
55%
Cholesterol
100mg
0mg
33%
Sodium
629mg
3mg
27%
Selenium
14.5µg
26%
Zinc
2.38mg
5.05mg
24%
Folate
65µg
160µg
24%
Vitamin A
174µg
3µg
19%
Fats
27.68g
38.45g
17%
Potassium
152mg
687mg
16%
Vitamin B3
0.38mg
2.284mg
12%
Carbs
0.45g
34.29g
11%
Calcium
184mg
78mg
11%
Calories
334kcal
517kcal
9%
Protein
20.75g
16.18g
9%
Vitamin B2
0.52mg
0.415mg
8%
Monounsaturated fat
8.013g
4.848g
8%
Vitamin D*
20 IU
0 IU
3%
Vitamin D
0.5µg
0µg
3%
Choline
15.4mg
3%
Vitamin E
0.24mg
2%
Vitamin K
2.3µg
2%
Protein per 100 calories
6.2g
3.1g
N/A
Calories per 10 g protein
161kcal
320kcal
N/A
Weight per 100 calories
30g
19g
N/A
Unsaturated / Saturated Fat ratio
0.51
9
N/A
Net carbs
0.45g
34.29g
N/A
Sugar
0.45g
N/A
Tryptophan
0.322mg
0.183mg
0%
Threonine
0.751mg
0.586mg
0%
Isoleucine
1.015mg
0.717mg
0%
Leucine
1.929mg
1.154mg
0%
Lysine
1.851mg
0.534mg
0%
Methionine
0.592mg
0.284mg
0%
Phenylalanine
1.158mg
0.806mg
0%
Valine
1.34mg
1.025mg
0%
Histidine
0.716mg
0.452mg
0%
Macronutrient Comparison
Macronutrient breakdown side-by-side comparison
2
21%
28%
48%
3%
Protein:
20.75 g
Fats:
27.68 g
Carbs:
0.45 g
Water:
48.42 g
Other:
2.7 g
3
16%
38%
34%
6%
5%
Protein:
16.18 g
Fats:
38.45 g
Carbs:
34.29 g
Water:
5.62 g
Other:
5.46 g
Contains
more
Protein Protein
+28.2%
Contains
more
Water Water
+761.6%
Contains
more
Fats Fats
+38.9%
Contains
more
Carbs Carbs
+7520%
Contains
more
Other Other
+102.2%
Fat Type Comparison
Fat type breakdown side-by-side comparison
1
66%
31%
3%
Saturated fat:
Sat. Fat
17.41 g
Monounsaturated fat:
Mono. Fat
8.013 g
Polyunsaturated fat:
Poly. Fat
0.826 g
2
10%
13%
77%
Saturated fat:
Sat. Fat
3.682 g
Monounsaturated fat:
Mono. Fat
4.848 g
Polyunsaturated fat:
Poly. Fat
28.223 g
Contains
more
Mono. Fat Monounsaturated fat
+65.3%
Contains
less
Sat. Fat Saturated fat
-78.9%
Contains
more
Poly. Fat Polyunsaturated fat
+3316.8%