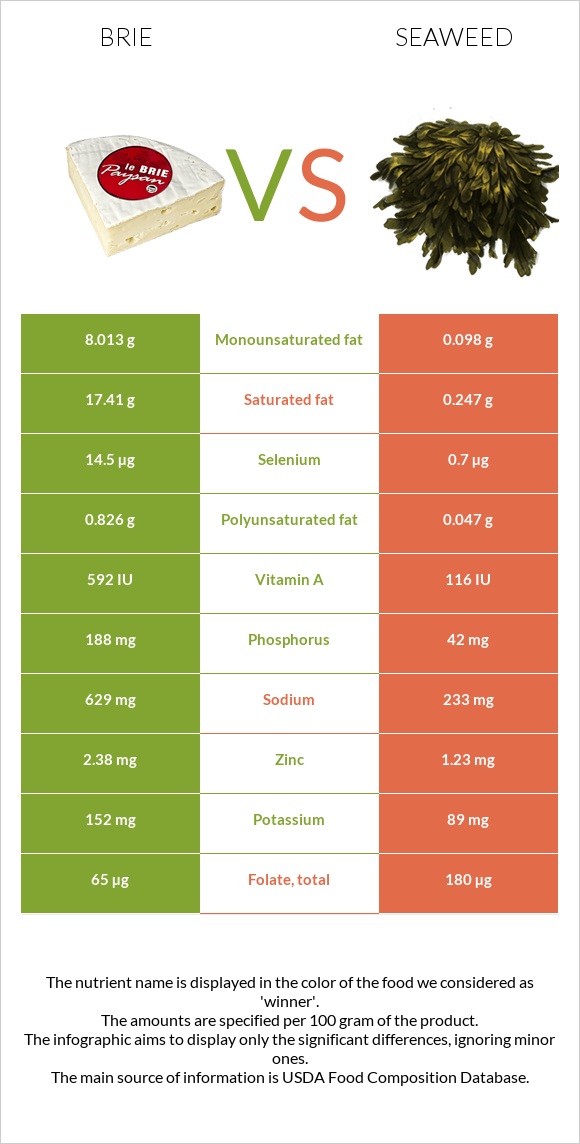
Differences between brie and seaweed Brie has more vitamin B12, vitamin B2, selenium, and phosphorus, while seaweed has more vitamin K, iron, folate, and magnesium. Brie's daily need coverage for saturated fat is 86% higher. The amount of cholesterol in seaweed is lower. The food types used in this comparison are Cheese, brie and Seaweed, kelp, raw .
Infographic
Mineral Comparison
Mineral comparison score is based on the number of minerals by which one or the other food is richer. The "coverage" charts below show how much of the daily needs can be covered by 300 grams of the food.
4
100 g
300 g
1 cubic inch - 17g 1 oz - 28.35g 1 package (4.5 oz) - 128g 1 cup, sliced - 144g 1 cup, melted - 240g
Magnesium
Magnesium
Calcium
Calcium
Potassium
Potassium
Iron
Iron
Copper
Copper
Zinc
Zinc
Phosphorus
Phosphorus
Sodium
Sodium
Manganese
Manganese
Selenium
Selenium
14%
55%
13%
19%
6.3%
65%
81%
82%
4.4%
79%
5
100 g
300 g
2 tbsp (1/8 cup) - 10g
Magnesium
Magnesium
Calcium
Calcium
Potassium
Potassium
Iron
Iron
Copper
Copper
Zinc
Zinc
Phosphorus
Phosphorus
Sodium
Sodium
Manganese
Manganese
Selenium
Selenium
86%
50%
7.9%
107%
43%
34%
18%
30%
26%
3.8%
Vitamin Comparison
Vitamin comparison score is based on the number of vitamins by which one or the other food is richer. The "coverage" charts below show how much of the daily needs can be covered by 300 grams of the food.
6
100 g
300 g
1 cubic inch - 17g 1 oz - 28.35g 1 package (4.5 oz) - 128g 1 cup, sliced - 144g 1 cup, melted - 240g
Vitamin C
Vit. C
Vitamin D
Vit. D
Vitamin A
Vit. A
Vitamin E
Vit. E
Vitamin B1
Vit. B1
Vitamin B2
Vit. B2
Vitamin B3
Vit. B3
Vitamin B5
Vit. B5
Vitamin B6
Vit. B6
Vitamin B12
Vit. B12
Vitamin K
Vit. K
Folate
Folate
0%
7.5%
58%
4.8%
18%
120%
7.1%
41%
54%
206%
5.8%
49%
5
100 g
300 g
2 tbsp (1/8 cup) - 10g
Vitamin C
Vit. C
Vitamin D
Vit. D
Vitamin A
Vit. A
Vitamin E
Vit. E
Vitamin B1
Vit. B1
Vitamin B2
Vit. B2
Vitamin B3
Vit. B3
Vitamin B5
Vit. B5
Vitamin B6
Vit. B6
Vitamin B12
Vit. B12
Vitamin K
Vit. K
Folate
Folate
10%
0%
2%
17%
13%
35%
8.8%
39%
0.46%
0%
165%
135%
All nutrients comparison - raw data values
Nutrient
DV% diff.
Saturated fat
17.41g
0.247g
78%
Vitamin B12
1.65µg
0µg
69%
Vitamin K
2.3µg
66µg
53%
Fats
27.68g
0.56g
42%
Protein
20.75g
1.68g
38%
Cholesterol
100mg
0mg
33%
Iron
0.5mg
2.85mg
29%
Folate
65µg
180µg
29%
Vitamin B2
0.52mg
0.15mg
28%
Selenium
14.5µg
0.7µg
25%
Magnesium
20mg
121mg
24%
Phosphorus
188mg
42mg
21%
Monounsaturated fat
8.013g
0.098g
20%
Vitamin A
174µg
6µg
19%
Vitamin B6
0.235mg
0.002mg
18%
Sodium
629mg
233mg
17%
Calories
334kcal
43kcal
15%
Copper
0.019mg
0.13mg
12%
Zinc
2.38mg
1.23mg
10%
Manganese
0.034mg
0.2mg
7%
Fiber
0g
1.3g
5%
Polyunsaturated fat
0.826g
0.047g
5%
Vitamin E
0.24mg
0.87mg
4%
Vitamin C
0mg
3mg
3%
Carbs
0.45g
9.57g
3%
Vitamin D*
20 IU
0 IU
3%
Vitamin D
0.5µg
0µg
3%
Calcium
184mg
168mg
2%
Potassium
152mg
89mg
2%
Vitamin B1
0.07mg
0.05mg
2%
Vitamin B3
0.38mg
0.47mg
1%
Vitamin B5
0.69mg
0.642mg
1%
Protein per 100 calories
6.2g
3.9g
N/A
Calories per 10 g protein
161kcal
256kcal
N/A
Weight per 100 calories
30g
233g
N/A
Unsaturated / Saturated Fat ratio
0.51
0.59
N/A
Net carbs
0.45g
8.27g
N/A
Sugar
0.45g
0.6g
N/A
Choline
15.4mg
12.8mg
0%
Tryptophan
0.322mg
0.048mg
0%
Threonine
0.751mg
0.055mg
0%
Isoleucine
1.015mg
0.076mg
0%
Leucine
1.929mg
0.083mg
0%
Lysine
1.851mg
0.082mg
0%
Methionine
0.592mg
0.025mg
0%
Phenylalanine
1.158mg
0.043mg
0%
Valine
1.34mg
0.072mg
0%
Histidine
0.716mg
0.024mg
0%
Omega-3 - EPA
0g
0.004g
N/A
Macronutrient Comparison
Macronutrient breakdown side-by-side comparison
2
21%
28%
48%
3%
Protein:
20.75 g
Fats:
27.68 g
Carbs:
0.45 g
Water:
48.42 g
Other:
2.7 g
3
2%
10%
82%
7%
Protein:
1.68 g
Fats:
0.56 g
Carbs:
9.57 g
Water:
81.58 g
Other:
6.61 g
Contains
more
Protein Protein
+1135.1%
Contains
more
Fats Fats
+4842.9%
Contains
more
Carbs Carbs
+2026.7%
Contains
more
Water Water
+68.5%
Contains
more
Other Other
+144.8%
Fat Type Comparison
Fat type breakdown side-by-side comparison
2
66%
31%
3%
Saturated fat:
Sat. Fat
17.41 g
Monounsaturated fat:
Mono. Fat
8.013 g
Polyunsaturated fat:
Poly. Fat
0.826 g
1
63%
25%
12%
Saturated fat:
Sat. Fat
0.247 g
Monounsaturated fat:
Mono. Fat
0.098 g
Polyunsaturated fat:
Poly. Fat
0.047 g
Contains
more
Mono. Fat Monounsaturated fat
+8076.5%
Contains
more
Poly. Fat Polyunsaturated fat
+1657.4%
Contains
less
Sat. Fat Saturated fat
-98.6%