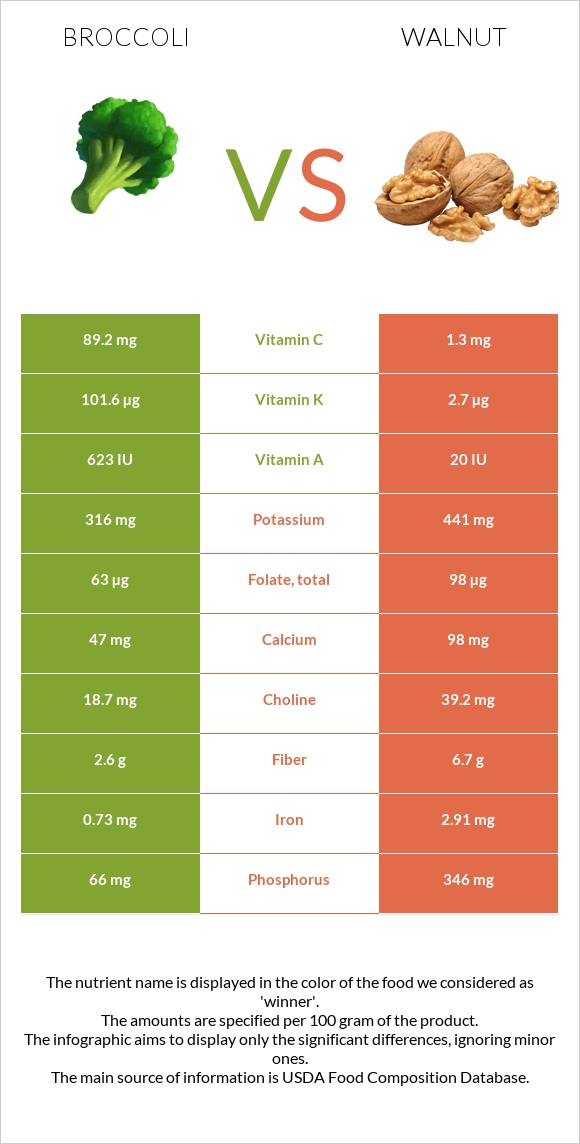
A recap on the differences between broccoli and walnut Broccoli has more vitamin C and vitamin K; however, walnut is higher in copper, manganese, phosphorus, magnesium, vitamin B6, iron, and zinc. Walnut covers your daily copper needs 171% more than broccoli. Walnut contains 69 times less vitamin C than broccoli. Broccoli contains 89.2mg of vitamin C, while walnut contains 1.3mg. Broccoli has less saturated fat. The glycemic index of broccoli is higher. Food varieties used in this article are Broccoli, raw and Nuts, walnuts, english .
Infographic
Mineral Comparison
Mineral comparison score is based on the number of minerals by which one or the other food is richer. The "coverage" charts below show how much of the daily needs can be covered by 300 grams of the food.
0
100 g
300 g
1 spear (about 5" long) - 31g 0.5 cup, chopped or diced - 44g 1 cup chopped - 91g 1 NLEA serving - 148g 1 stalk - 151g 1 bunch - 608g
Magnesium
Magnesium
Calcium
Calcium
Potassium
Potassium
Iron
Iron
Copper
Copper
Zinc
Zinc
Phosphorus
Phosphorus
Sodium
Sodium
Manganese
Manganese
Selenium
Selenium
15%
14%
28%
27%
16%
11%
28%
4.3%
27%
14%
10
100 g
300 g
1 cup, in shell, edible yield (7 nuts) - 28g 1 oz (14 halves) - 28.35g 1 cup, ground - 80g 1 cup, chopped - 117g 1 cup pieces or chips - 120g
Magnesium
Magnesium
Calcium
Calcium
Potassium
Potassium
Iron
Iron
Copper
Copper
Zinc
Zinc
Phosphorus
Phosphorus
Sodium
Sodium
Manganese
Manganese
Selenium
Selenium
113%
29%
39%
109%
529%
84%
148%
0.26%
445%
27%
Vitamin Comparison
Vitamin comparison score is based on the number of vitamins by which one or the other food is richer. The "coverage" charts below show how much of the daily needs can be covered by 300 grams of the food.
4
100 g
300 g
1 spear (about 5" long) - 31g 0.5 cup, chopped or diced - 44g 1 cup chopped - 91g 1 NLEA serving - 148g 1 stalk - 151g 1 bunch - 608g
Vitamin C
Vit. C
Vitamin D
Vit. D
Vitamin A
Vit. A
Vitamin E
Vit. E
Vitamin B1
Vit. B1
Vitamin B2
Vit. B2
Vitamin B3
Vit. B3
Vitamin B5
Vit. B5
Vitamin B6
Vit. B6
Vitamin B12
Vit. B12
Vitamin K
Vit. K
Folate
Folate
297%
0%
10%
16%
18%
27%
12%
34%
40%
0%
254%
47%
5
100 g
300 g
1 cup, in shell, edible yield (7 nuts) - 28g 1 oz (14 halves) - 28.35g 1 cup, ground - 80g 1 cup, chopped - 117g 1 cup pieces or chips - 120g
Vitamin C
Vit. C
Vitamin D
Vit. D
Vitamin A
Vit. A
Vitamin E
Vit. E
Vitamin B1
Vit. B1
Vitamin B2
Vit. B2
Vitamin B3
Vit. B3
Vitamin B5
Vit. B5
Vitamin B6
Vit. B6
Vitamin B12
Vit. B12
Vitamin K
Vit. K
Folate
Folate
4.3%
0%
0.33%
14%
85%
35%
21%
34%
124%
0%
6.8%
74%
All nutrients comparison - raw data values
Nutrient
DV% diff.
Polyunsaturated fat
0.038g
47.174g
314%
Copper
0.049mg
1.586mg
171%
Manganese
0.21mg
3.414mg
139%
Fats
0.37g
65.21g
100%
Vitamin C
89.2mg
1.3mg
98%
Vitamin K
101.6µg
2.7µg
82%
Phosphorus
66mg
346mg
40%
Magnesium
21mg
158mg
33%
Calories
34kcal
654kcal
31%
Vitamin B6
0.175mg
0.537mg
28%
Saturated fat
0.039g
6.126g
28%
Iron
0.73mg
2.91mg
27%
Protein
2.82g
15.23g
25%
Zinc
0.41mg
3.09mg
24%
Vitamin B1
0.071mg
0.341mg
23%
Monounsaturated fat
0.011g
8.933g
22%
Fiber
2.6g
6.7g
16%
Folate
63µg
98µg
9%
Calcium
47mg
98mg
5%
Potassium
316mg
441mg
4%
Selenium
2.5µg
4.9µg
4%
Choline
18.7mg
39.2mg
4%
Vitamin A
31µg
1µg
3%
Vitamin B2
0.117mg
0.15mg
3%
Vitamin B3
0.639mg
1.125mg
3%
Carbs
6.64g
13.71g
2%
Sodium
33mg
2mg
1%
Vitamin E
0.78mg
0.7mg
1%
Fructose
0.68g
0.09g
1%
Protein per 100 calories
8.3g
2.3g
N/A
Calories per 10 g protein
121kcal
429kcal
N/A
Weight per 100 calories
294g
15g
N/A
Unsaturated / Saturated Fat ratio
1.3
9.2
N/A
Net carbs
4.04g
7.01g
N/A
Sugar
1.7g
2.61g
N/A
Starch
0g
0.06g
0%
Vitamin B5
0.573mg
0.57mg
0%
Tryptophan
0.033mg
0.17mg
0%
Threonine
0.088mg
0.596mg
0%
Isoleucine
0.079mg
0.625mg
0%
Leucine
0.129mg
1.17mg
0%
Lysine
0.135mg
0.424mg
0%
Methionine
0.038mg
0.236mg
0%
Phenylalanine
0.117mg
0.711mg
0%
Valine
0.125mg
0.753mg
0%
Histidine
0.059mg
0.391mg
0%
Macronutrient Comparison
Macronutrient breakdown side-by-side comparison
1
3%
7%
89%
Protein:
2.82 g
Fats:
0.37 g
Carbs:
6.64 g
Water:
89.3 g
Other:
0.87 g
4
15%
65%
14%
4%
2%
Protein:
15.23 g
Fats:
65.21 g
Carbs:
13.71 g
Water:
4.07 g
Other:
1.78 g
Contains
more
Water Water
+2094.1%
Contains
more
Protein Protein
+440.1%
Contains
more
Fats Fats
+17524.3%
Contains
more
Carbs Carbs
+106.5%
Contains
more
Other Other
+104.6%
Fat Type Comparison
Fat type breakdown side-by-side comparison
1
44%
13%
43%
Saturated fat:
Sat. Fat
0.039 g
Monounsaturated fat:
Mono. Fat
0.011 g
Polyunsaturated fat:
Poly. Fat
0.038 g
2
10%
14%
76%
Saturated fat:
Sat. Fat
6.126 g
Monounsaturated fat:
Mono. Fat
8.933 g
Polyunsaturated fat:
Poly. Fat
47.174 g
Contains
less
Sat. Fat Saturated fat
-99.4%
Contains
more
Mono. Fat Monounsaturated fat
+81109.1%
Contains
more
Poly. Fat Polyunsaturated fat
+124042.1%
Carbohydrate type comparison
Carbohydrate type breakdown side-by-side comparison
4
6%
29%
40%
12%
12%
Starch:
0 g
Sucrose:
0.1 g
Glucose:
0.49 g
Fructose:
0.68 g
Lactose:
0.21 g
Maltose:
0.21 g
Galactose:
0 g
2
2%
91%
3%
3%
Starch:
0.06 g
Sucrose:
2.43 g
Glucose:
0.08 g
Fructose:
0.09 g
Lactose:
0 g
Maltose:
0 g
Galactose:
0 g
Contains
more
Glucose Glucose
+512.5%
Contains
more
Fructose Fructose
+655.6%
Contains
more
Lactose Lactose
+∞%
Contains
more
Maltose Maltose
+∞%
Contains
more
Starch Starch
+∞%
Contains
more
Sucrose Sucrose
+2330%