Walnut nutrition: calories, carbs, GI, protein, fiber, fats
Carbs in Walnut
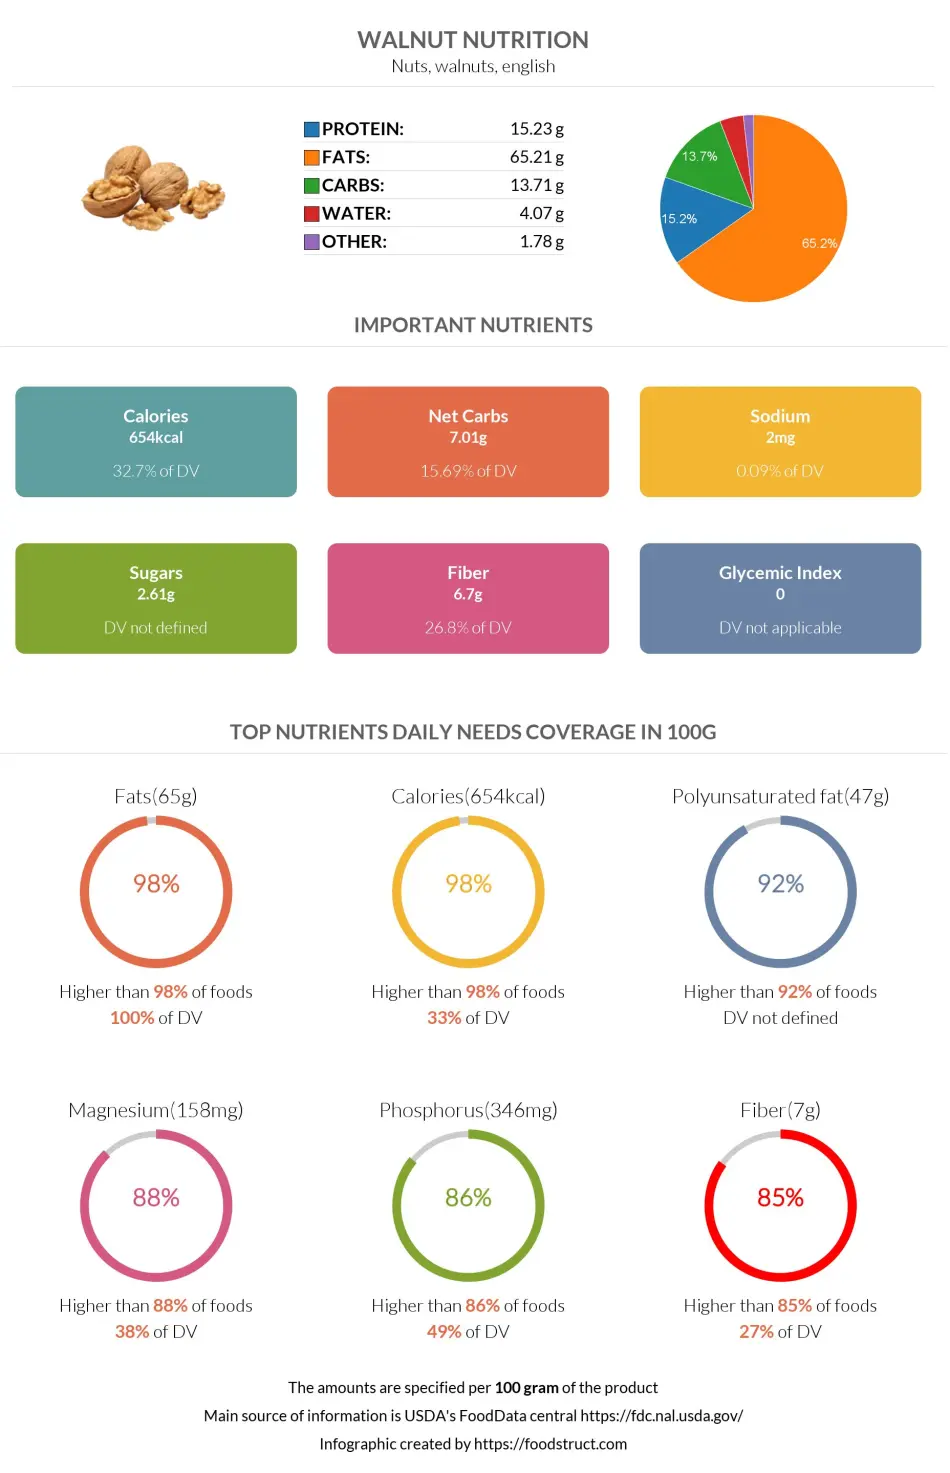
100g of walnuts contain 13.71g of carbs, which covers 5% of the daily need (in the case of a 2000-calorie diet).
Macronutrients chart
Carbs per serving size
The average serving size of walnuts is 14 halves (1 oz or 28.35g). One serving of walnuts contains 3.88g of carbs.
One cup of chopped walnuts (117g) contains 16g of carbs, whereas one cup of ground walnuts (80g) contains 11g of carbs.
Carbohydrate type breakdown
The predominant carb that breaks down to simple sugars is sucrose. Walnut contains an insignificant level of glucose, fructose, and starch.
Carbohydrate type breakdown
Walnut net carbs
100g of walnuts contain 7.01g of net carbs, 51% of the overall carb content (17.31g). The remaining 49% (6.7g) is dietary fiber. As walnut is low in carbs, it is an excellent addition to low-carb diets, such as keto.
Soluble and insoluble fiber
One oz of walnuts contains ~1.8g dietary fiber: 25% (0.45g) soluble dietary fiber and 75% (1.35g) insoluble dietary fiber (1).
Fiber content ratio for Walnut
Walnut Calories
Calories per 100g
Walnut is a high-calorie food. One hundred grams of walnuts provides 654 calories, predominantly provided by fats.

Top nutrition facts for Walnut
| Calories ⓘ Calories for selected serving | 654 kcal |
|
Glycemic index ⓘ
Source:
Check out our Glycemic index chart page for the full list.
|
0 (low) |
| Glycemic load ⓘ Glycemic Load (GL) is a metric that measures both the quality (Glycemic Index) and quantity of carbohydrates in a specific serving of food to estimate its impact on blood sugar levels. It is calculated as: (GI × Carbs in grams) / 100. | 0 (low) |
| Insulin index ⓘ The insulin index of foods demonstrates how much a food increases the insulin level in the blood, in the first two-hour period after consumption. | 7 ⓘ https://www.researchgate.net/publication/26770180 – 7 |
| Net carbs ⓘ Net Carbs = Total Carbohydrates – Fiber – Sugar Alcohols | 7 g |
| Default serving size ⓘ Serving sizes are mostly taken from FDA's Reference Amounts Customarily Consumed (RACCs) | 1 oz (14 halves) (28.35 g) |
| Acidity (Based on PRAL) ⓘ PRAL (Potential renal acid load) is calculated using a formula. On the PRAL scale the higher the positive value, the more is the acidifying effect on the body. The lower the negative value, the higher the alkalinity of the food. 0 is neutral. | 5.6 (acidic) |
| Oxalates | 54 mg ⓘ https://www.sciencedirect.com/science/article/abs/pii/S0889157513000902 |
Walnut calories (kcal)
| Calories for different serving sizes of walnut | Calories | Weight |
|---|---|---|
| Calories in 100 grams | 654 | |
| Calories in 1 cup, ground | 523 | 80 g |
| Calories in 1 cup, chopped | 765 | 117 g |
| Calories in 1 cup pieces or chips | 785 | 120 g |
| Calories for different varieties of walnut | Calories | Weight |
|---|---|---|
| Nuts, walnuts, english (this food) | 654 | 100 g |
| Nuts, walnuts, black, dried | 619 | 100 g |
| Nuts, walnuts, dry roasted, with salt added | 643 | 100 g |
Extra Nutrition facts for Walnut
| Protein per 100 calories ⓘ Shows how many grams of protein you get from 100 calories of this food, calculated as (protein in g ÷ calories) × 100. | 2.3 g |
| Calories per 10 g protein ⓘ Shows how many calories you need to eat from this food to get 10 g of protein, calculated as (calories ÷ protein in g) × 10. | 429 kcal |
| Weight per 100 calories ⓘ Shows how many grams of this food equal 100 kcal—higher grams mean a larger portion for the same calories. | 15 g |
| Unsaturated / Saturated Fat ratio ⓘ (monounsaturated + polyunsaturated) / saturated, ≥2 broadly recommended by major guidelines for heart health | 9.2 |
Walnut Glycemic index (GI)
Mineral coverage chart
Mineral chart - relative view
Vitamin coverage chart
Vitamin chart - relative view
Protein quality breakdown
Fat type information
All nutrients for Walnut per 100g
| Nutrient | Value | DV% | In TOP % of foods | Comparison |
| Vitamin A | 1µg | 0% | 55% | |
| Calories | 654kcal | 33% | 2% |
13.9 times more than Orange
|
| Protein per 100 calories | 2.3g | N/A | 68% | |
| Protein | 15g | 36% | 34% |
5.4 times more than Broccoli
|
| Calories per 10 g protein | 429kcal | N/A | 29% | |
| Weight per 100 calories | 15g | N/A | 98% | |
| Fats | 65g | 100% | 3% |
2 times more than Cheese
|
| Unsaturated / Saturated Fat ratio | 9.2 | N/A | 2% | |
| Vitamin C | 1.3mg | 1% | 30% |
40.8 times less than Lemon
|
| Net carbs | 7g | N/A | 52% |
7.7 times less than Chocolate
|
| Carbs | 14g | 5% | 43% |
2.1 times less than Rice
|
| Cholesterol | 0mg | 0% | 100% |
N/A
|
| Vitamin D | 0µg | 0% | 100% |
N/A
|
| Vitamin D* | 0 IU | 0% | 100% |
N/A
|
| Magnesium | 158mg | 38% | 4% |
1.1 times more than Almonds
|
| Calcium | 98mg | 10% | 19% |
1.3 times less than Milk
|
| Potassium | 441mg | 13% | 11% |
3 times more than Cucumber
|
| Iron | 2.9mg | 36% | 21% |
1.1 times more than Beef broiled
|
| Sugar | 2.6g | N/A | 36% |
3.4 times less than Coca-Cola
|
| Fiber | 6.7g | 27% | 9% |
2.8 times more than Orange
|
| Copper | 1.6mg | 176% | 2% |
11.2 times more than Shiitake
|
| Zinc | 3.1mg | 28% | 22% |
2 times less than Beef broiled
|
| Starch | 0.06g | 0% | 11% |
254.8 times less than Potato
|
| Phosphorus | 346mg | 49% | 7% |
1.9 times more than Chicken meat
|
| Sodium | 2mg | 0% | 95% |
245 times less than White bread
|
| Vitamin E | 0.7mg | 5% | 19% |
2.1 times less than Kiwi
|
| Manganese | 3.4mg | 148% | 2% | |
| Selenium | 4.9µg | 9% | 49% | |
| Vitamin B1 | 0.34mg | 28% | 18% |
1.3 times more than Pea raw
|
| Vitamin B2 | 0.15mg | 12% | 51% |
1.2 times more than Avocado
|
| Vitamin B3 | 1.1mg | 7% | 60% |
8.5 times less than Turkey meat
|
| Vitamin B5 | 0.57mg | 11% | 29% |
2 times less than Sunflower seeds
|
| Vitamin B6 | 0.54mg | 41% | 13% |
4.5 times more than Oats
|
| Vitamin B12 | 0µg | 0% | 100% |
N/A
|
| Vitamin K | 2.7µg | 2% | 21% |
37.6 times less than Broccoli
|
| Folate | 98µg | 25% | 10% |
1.6 times more than Brussels sprouts
|
| Choline | 39mg | 7% | 22% | |
| Saturated fat | 6.1g | 31% | 17% |
Equal to Beef broiled
|
| Monounsaturated fat | 8.9g | N/A | 11% |
1.1 times less than Avocado
|
| Polyunsaturated fat | 47g | N/A | 1% |
Equal to Walnut
|
| Tryptophan | 0.17mg | 0% | 28% |
1.8 times less than Chicken meat
|
| Threonine | 0.6mg | 0% | 30% |
1.2 times less than Beef broiled
|
| Isoleucine | 0.63mg | 0% | 30% |
1.5 times less than Salmon raw
|
| Leucine | 1.2mg | 0% | 30% |
2.1 times less than Tuna Bluefin
|
| Lysine | 0.42mg | 0% | 37% |
1.1 times less than Tofu
|
| Methionine | 0.24mg | 0% | 33% |
2.5 times more than Quinoa
|
| Phenylalanine | 0.71mg | 0% | 27% |
1.1 times more than Egg
|
| Valine | 0.75mg | 0% | 30% |
2.7 times less than Soybean raw
|
| Histidine | 0.39mg | 0% | 31% |
1.9 times less than Turkey meat
|
| Fructose | 0.09g | 0% | 13% |
65.6 times less than Apple
|
| Caffeine | 0mg | 0% | 100% | |
| Omega-3 - EPA | 0g | N/A | 100% |
N/A
|
| Omega-3 - DHA | 0g | N/A | 100% |
N/A
|
| Omega-3 - DPA | 0g | N/A | 100% |
N/A
|
| Omega-6 - Eicosadienoic acid | 0g | N/A | 100% |
Check out similar food or compare with current
NUTRITION FACTS LABEL
Serving Size ______________
Health checks
Walnut nutrition infographic
References
All the values for which the sources are not specified explicitly are taken from FDA’s Food Central. The exact link to the food presented on this page can be found below.