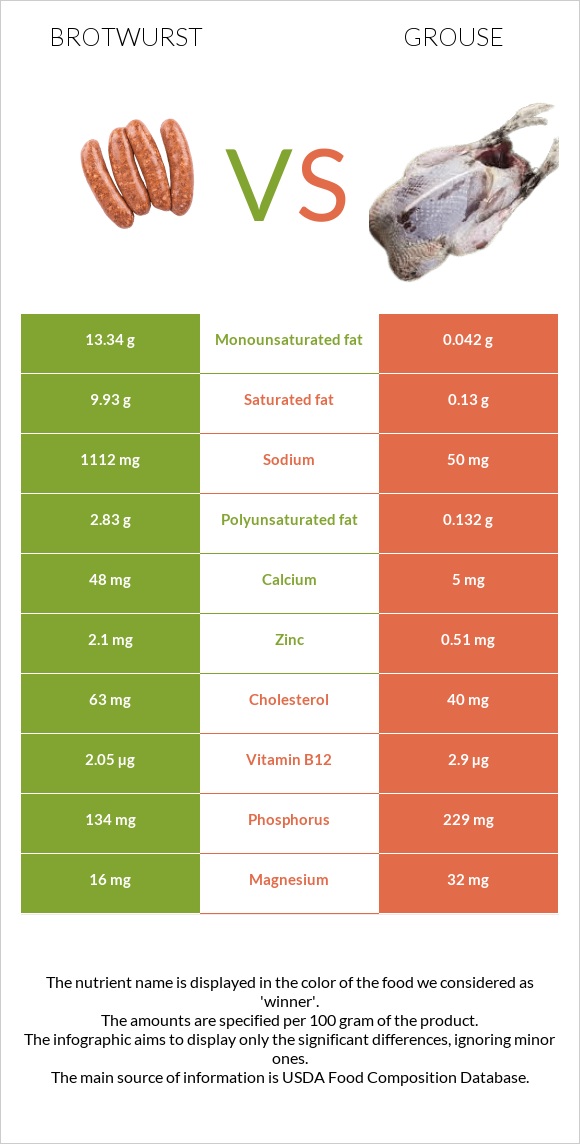
How are brotwurst and grouse different? Brotwurst is richer in vitamin B1, zinc, and iron, while grouse is higher in vitamin B6, vitamin B3, vitamin B12, and phosphorus. Grouse covers your daily need for vitamin B6, 88% more than brotwurst. Brotwurst contains 76 times more saturated fat than grouse. Brotwurst contains 9.93g of saturated fat, while grouse contains 0.13g. Brotwurst, pork, beef, link and Ruffed Grouse, breast meat, skinless, raw types were used in this article.
Infographic
Mineral Comparison
Mineral comparison score is based on the number of minerals by which one or the other food is richer. The "coverage" charts below show how much of the daily needs can be covered by 300 grams of the food.
6
100 g
300 g
1 link - 70g
Magnesium
Magnesium
Calcium
Calcium
Potassium
Potassium
Iron
Iron
Copper
Copper
Zinc
Zinc
Phosphorus
Phosphorus
Sodium
Sodium
Manganese
Manganese
Selenium
Selenium
11%
14%
25%
39%
27%
57%
57%
145%
5.2%
93%
4
100 g
300 g
4 oz - 113g 1 breast - 219g 1 bird - 627g
Magnesium
Magnesium
Calcium
Calcium
Potassium
Potassium
Iron
Iron
Copper
Copper
Zinc
Zinc
Phosphorus
Phosphorus
Sodium
Sodium
Manganese
Manganese
Selenium
Selenium
23%
1.5%
27%
22%
19%
14%
98%
6.5%
2.1%
0%
Vitamin Comparison
Vitamin comparison score is based on the number of vitamins by which one or the other food is richer. The "coverage" charts below show how much of the daily needs can be covered by 300 grams of the food.
4
100 g
300 g
1 link - 70g
Vitamin C
Vit. C
Vitamin D
Vit. D
Vitamin A
Vit. A
Vitamin E
Vit. E
Vitamin B1
Vit. B1
Vitamin B2
Vit. B2
Vitamin B3
Vit. B3
Vitamin B5
Vit. B5
Vitamin B6
Vit. B6
Vitamin B12
Vit. B12
Vitamin K
Vit. K
Folate
Folate
0%
4.5%
0%
5.4%
63%
53%
62%
3.6%
30%
256%
0%
3.8%
6
100 g
300 g
4 oz - 113g 1 breast - 219g 1 bird - 627g
Vitamin C
Vit. C
Vitamin D
Vit. D
Vitamin A
Vit. A
Vitamin E
Vit. E
Vitamin B1
Vit. B1
Vitamin B2
Vit. B2
Vitamin B3
Vit. B3
Vitamin B5
Vit. B5
Vitamin B6
Vit. B6
Vitamin B12
Vit. B12
Vitamin K
Vit. K
Folate
Folate
0%
0%
1.7%
15%
11%
65%
218%
0%
294%
363%
0%
0%
All nutrients comparison - raw data values
Nutrient
DV% diff.
Vitamin B6
0.13mg
1.275mg
88%
Vitamin B3
3.3mg
11.6mg
52%
Sodium
1112mg
50mg
46%
Saturated fat
9.93g
0.13g
45%
Fats
27.8g
0.88g
41%
Vitamin B12
2.05µg
2.9µg
35%
Monounsaturated fat
13.34g
0.042g
33%
Selenium
17µg
31%
Protein
14.3g
25.94g
23%
Polyunsaturated fat
2.83g
0.132g
18%
Vitamin B1
0.25mg
0.042mg
17%
Zinc
2.1mg
0.51mg
14%
Phosphorus
134mg
229mg
14%
Calories
323kcal
112kcal
11%
Cholesterol
63mg
40mg
8%
Iron
1.03mg
0.58mg
6%
Magnesium
16mg
32mg
4%
Calcium
48mg
5mg
4%
Vitamin B2
0.23mg
0.28mg
4%
Vitamin E
0.27mg
0.73mg
3%
Vitamin D
0.3µg
2%
Copper
0.08mg
0.058mg
2%
Carbs
2.98g
0g
1%
Vitamin D*
11 IU
1%
Potassium
281mg
311mg
1%
Vitamin A
0µg
5µg
1%
Manganese
0.04mg
0.016mg
1%
Vitamin B5
0.06mg
1%
Folate
5µg
1%
Protein per 100 calories
4.4g
23g
N/A
Calories per 10 g protein
226kcal
43kcal
N/A
Weight per 100 calories
31g
89g
N/A
Unsaturated / Saturated Fat ratio
1.6
1.3
N/A
Net carbs
2.98g
0g
N/A
Sugar
2.98g
0g
N/A
Tryptophan
0.13mg
0%
Threonine
0.6mg
0%
Isoleucine
0.61mg
0%
Leucine
1.08mg
0%
Lysine
1.14mg
0%
Methionine
0.37mg
0%
Phenylalanine
0.54mg
0%
Valine
0.68mg
0%
Histidine
0.44mg
0%
Omega-3 - EPA
0g
0.003g
N/A
Omega-3 - DHA
0g
0.009g
N/A
Omega-3 - ALA
0.008g
N/A
Omega-3 - DPA
0g
0.008g
N/A
Omega-6 - Dihomo-gamma-linoleic acid
0.001g
N/A
Omega-6 - Eicosadienoic acid
0.001g
N/A
Omega-6 - Linoleic acid
0.071g
N/A
Macronutrient Comparison
Macronutrient breakdown side-by-side comparison
3
14%
28%
3%
51%
4%
Protein:
14.3 g
Fats:
27.8 g
Carbs:
2.98 g
Water:
51.3 g
Other:
3.62 g
2
26%
73%
Protein:
25.94 g
Fats:
0.88 g
Carbs:
0 g
Water:
72.93 g
Other:
0.25 g
Contains
more
Fats Fats
+3059.1%
Contains
more
Carbs Carbs
+∞%
Contains
more
Other Other
+1348%
Contains
more
Protein Protein
+81.4%
Contains
more
Water Water
+42.2%
Fat Type Comparison
Fat type breakdown side-by-side comparison
2
38%
51%
11%
Saturated fat:
Sat. Fat
9.93 g
Monounsaturated fat:
Mono. Fat
13.34 g
Polyunsaturated fat:
Poly. Fat
2.83 g
1
43%
14%
43%
Saturated fat:
Sat. Fat
0.13 g
Monounsaturated fat:
Mono. Fat
0.042 g
Polyunsaturated fat:
Poly. Fat
0.132 g
Contains
more
Mono. Fat Monounsaturated fat
+31661.9%
Contains
more
Poly. Fat Polyunsaturated fat
+2043.9%
Contains
less
Sat. Fat Saturated fat
-98.7%