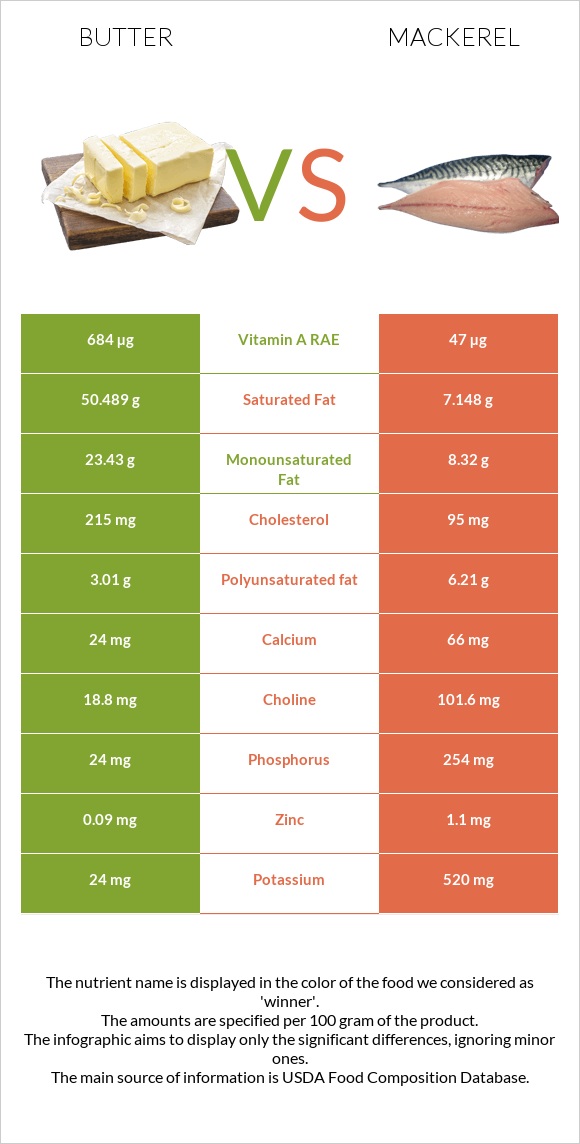
A recap on the differences between butter and mackerel Butter has more vitamin A; however, mackerel is higher in vitamin B12, selenium, vitamin D*, phosphorus, vitamin B6, and vitamin B3. Mackerel covers your daily vitamin B12 needs 493% more than butter. Mackerel contains 16 times less vitamin A than butter. Butter contains 2499 IU of vitamin A, while mackerel contains 157 IU. Mackerel has less saturated fat. Food varieties used in this article are Butter, without salt and Fish, mackerel, salted .
Infographic
Mineral Comparison
Mineral comparison score is based on the number of minerals by which one or the other food is richer. The "coverage" charts below show how much of the daily needs can be covered by 300 grams of the food.
2
100 g
300 g
1 pat (1" sq, 1/3" high) - 5g 1 tbsp - 14.2g 1 stick - 113g 1 cup - 227g
Magnesium
Magnesium
Calcium
Calcium
Potassium
Potassium
Iron
Iron
Copper
Copper
Zinc
Zinc
Phosphorus
Phosphorus
Sodium
Sodium
Manganese
Manganese
Selenium
Selenium
1.4%
7.2%
2.1%
0.75%
5.3%
2.5%
10%
1.4%
0.52%
5.5%
8
100 g
300 g
1 cubic inch, boneless - 17g 1 piece (5-1/2" x 1-1/2" x 1/2") - 80g 1 cup, cooked - 136g
Magnesium
Magnesium
Calcium
Calcium
Potassium
Potassium
Iron
Iron
Copper
Copper
Zinc
Zinc
Phosphorus
Phosphorus
Sodium
Sodium
Manganese
Manganese
Selenium
Selenium
43%
20%
46%
53%
33%
30%
109%
580%
0%
400%
Vitamin Comparison
Vitamin comparison score is based on the number of vitamins by which one or the other food is richer. The "coverage" charts below show how much of the daily needs can be covered by 300 grams of the food.
2
100 g
300 g
1 pat (1" sq, 1/3" high) - 5g 1 tbsp - 14.2g 1 stick - 113g 1 cup - 227g
Vitamin C
Vit. C
Vitamin D
Vit. D
Vitamin A
Vit. A
Vitamin E
Vit. E
Vitamin B1
Vit. B1
Vitamin B2
Vit. B2
Vitamin B3
Vit. B3
Vitamin B5
Vit. B5
Vitamin B6
Vit. B6
Vitamin B12
Vit. B12
Vitamin K
Vit. K
Folate
Folate
0%
0%
228%
46%
1.3%
7.8%
0.79%
6.6%
0.69%
21%
18%
2.3%
8
100 g
300 g
1 cubic inch, boneless - 17g 1 piece (5-1/2" x 1-1/2" x 1/2") - 80g 1 cup, cooked - 136g
Vitamin C
Vit. C
Vitamin D
Vit. D
Vitamin A
Vit. A
Vitamin E
Vit. E
Vitamin B1
Vit. B1
Vitamin B2
Vit. B2
Vitamin B3
Vit. B3
Vitamin B5
Vit. B5
Vitamin B6
Vit. B6
Vitamin B12
Vit. B12
Vitamin K
Vit. K
Folate
Folate
0%
378%
16%
48%
5%
44%
62%
0%
95%
1500%
20%
11%
All nutrients comparison - raw data values
Nutrient
DV% diff.
Vitamin B12
0.17µg
12µg
493%
Saturated fat
50.489g
7.148g
197%
Sodium
11mg
4450mg
193%
Selenium
1µg
73.4µg
132%
Vitamin D*
0 IU
1006 IU
126%
Vitamin D
0µg
25.2µg
126%
Fats
81.11g
25.1g
86%
Vitamin A
684µg
47µg
71%
Cholesterol
215mg
95mg
40%
Monounsaturated fat
23.43g
8.32g
38%
Protein
0.85g
18.5g
35%
Phosphorus
24mg
254mg
33%
Vitamin B6
0.003mg
0.41mg
31%
Calories
717kcal
305kcal
21%
Polyunsaturated fat
3.01g
6.21g
21%
Vitamin B3
0.042mg
3.3mg
20%
Iron
0.02mg
1.4mg
17%
Potassium
24mg
520mg
15%
Choline
18.8mg
101.6mg
15%
Magnesium
2mg
60mg
14%
Vitamin B2
0.034mg
0.19mg
12%
Copper
0.016mg
0.1mg
9%
Zinc
0.09mg
1.1mg
9%
Calcium
24mg
66mg
4%
Folate
3µg
15µg
3%
Vitamin B5
0.11mg
2%
Vitamin B1
0.005mg
0.02mg
1%
Vitamin K
7µg
7.8µg
1%
Protein per 100 calories
0.12g
6.1g
N/A
Calories per 10 g protein
8435kcal
165kcal
N/A
Weight per 100 calories
14g
33g
N/A
Unsaturated / Saturated Fat ratio
0.52
2
N/A
Net carbs
0.06g
0g
N/A
Carbs
0.06g
0g
0%
Sugar
0.06g
0g
N/A
Vitamin E
2.32mg
2.38mg
0%
Manganese
0.004mg
0%
Tryptophan
0.012mg
0%
Threonine
0.038mg
0%
Isoleucine
0.051mg
0%
Leucine
0.083mg
0%
Lysine
0.067mg
0%
Methionine
0.021mg
0%
Phenylalanine
0.041mg
0%
Valine
0.057mg
0%
Histidine
0.023mg
0%
Omega-3 - EPA
0g
1.619g
N/A
Omega-3 - DHA
0g
2.965g
N/A
Omega-3 - ALA
0.315g
N/A
Omega-3 - DPA
0g
0.391g
N/A
Omega-6 - Linoleic acid
2.166g
N/A
Macronutrient Comparison
Macronutrient breakdown side-by-side comparison
2
81%
18%
Protein:
0.85 g
Fats:
81.11 g
Carbs:
0.06 g
Water:
17.94 g
Other:
0.04 g
3
19%
25%
43%
13%
Protein:
18.5 g
Fats:
25.1 g
Carbs:
0 g
Water:
43 g
Other:
13.4 g
Contains
more
Fats Fats
+223.1%
Contains
more
Carbs Carbs
+∞%
Contains
more
Protein Protein
+2076.5%
Contains
more
Water Water
+139.7%
Contains
more
Other Other
+33400%
Fat Type Comparison
Fat type breakdown side-by-side comparison
1
66%
30%
4%
Saturated fat:
Sat. Fat
50.489 g
Monounsaturated fat:
Mono. Fat
23.43 g
Polyunsaturated fat:
Poly. Fat
3.01 g
2
33%
38%
29%
Saturated fat:
Sat. Fat
7.148 g
Monounsaturated fat:
Mono. Fat
8.32 g
Polyunsaturated fat:
Poly. Fat
6.21 g
Contains
more
Mono. Fat Monounsaturated fat
+181.6%
Contains
less
Sat. Fat Saturated fat
-85.8%
Contains
more
Poly. Fat Polyunsaturated fat
+106.3%