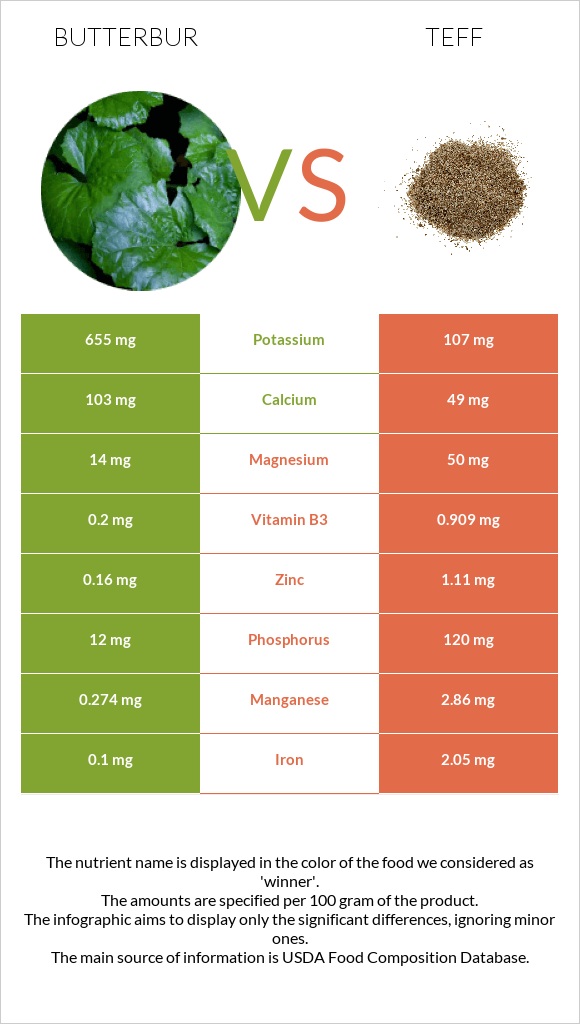
How are butterbur and teff different? Butterbur is higher in potassium and calcium; however, teff is richer in manganese, iron, phosphorus, copper, vitamin B1, zinc, and magnesium. Daily need coverage for manganese for teff is 112% higher. Butterbur contains 6 times more potassium than teff. While butterbur contains 655mg of potassium, teff contains only 107mg. Butterbur, (fuki), raw and Teff, cooked are the varieties used in this article.
Infographic
Mineral Comparison
Mineral comparison score is based on the number of minerals by which one or the other food is richer. The "coverage" charts below show how much of the daily needs can be covered by 300 grams of the food.
4
100 g
300 g
1 petiole - 5g 1 cup - 94g
Magnesium
Magnesium
Calcium
Calcium
Potassium
Potassium
Iron
Iron
Copper
Copper
Zinc
Zinc
Phosphorus
Phosphorus
Sodium
Sodium
Manganese
Manganese
Selenium
Selenium
10%
31%
58%
3.8%
34%
4.4%
5.1%
0.91%
36%
4.9%
6
100 g
300 g
1 cup - 252g
Magnesium
Magnesium
Calcium
Calcium
Potassium
Potassium
Iron
Iron
Copper
Copper
Zinc
Zinc
Phosphorus
Phosphorus
Sodium
Sodium
Manganese
Manganese
Selenium
Selenium
36%
15%
9.4%
77%
75%
30%
51%
1%
373%
0%
Vitamin Comparison
Vitamin comparison score is based on the number of vitamins by which one or the other food is richer. The "coverage" charts below show how much of the daily needs can be covered by 300 grams of the food.
3
100 g
300 g
1 petiole - 5g 1 cup - 94g
Vitamin C
Vit. C
Vitamin D
Vit. D
Vitamin A
Vit. A
Vitamin E
Vit. E
Vitamin B1
Vit. B1
Vitamin B2
Vit. B2
Vitamin B3
Vit. B3
Vitamin B5
Vit. B5
Vitamin B6
Vit. B6
Vitamin B12
Vit. B12
Vitamin K
Vit. K
Folate
Folate
105%
0%
1%
0%
5%
4.6%
3.8%
1.9%
22%
0%
0%
7.5%
4
100 g
300 g
1 cup - 252g
Vitamin C
Vit. C
Vitamin D
Vit. D
Vitamin A
Vit. A
Vitamin E
Vit. E
Vitamin B1
Vit. B1
Vitamin B2
Vit. B2
Vitamin B3
Vit. B3
Vitamin B5
Vit. B5
Vitamin B6
Vit. B6
Vitamin B12
Vit. B12
Vitamin K
Vit. K
Folate
Folate
0%
0%
0%
0%
46%
7.6%
17%
0%
22%
0%
0%
14%
All nutrients comparison - raw data values
Nutrient
DV% diff.
Manganese
0.274mg
2.86mg
112%
Vitamin C
31.5mg
35%
Iron
0.1mg
2.05mg
24%
Potassium
655mg
107mg
16%
Phosphorus
12mg
120mg
15%
Copper
0.103mg
0.226mg
14%
Vitamin B1
0.02mg
0.183mg
14%
Fiber
2.8g
11%
Magnesium
14mg
50mg
9%
Zinc
0.16mg
1.11mg
9%
Protein
0.39g
3.87g
7%
Carbs
3.61g
19.86g
5%
Calcium
103mg
49mg
5%
Calories
14kcal
101kcal
4%
Vitamin B3
0.2mg
0.909mg
4%
Selenium
0.9µg
2%
Folate
10µg
18µg
2%
Fats
0.04g
0.65g
1%
Vitamin B2
0.02mg
0.033mg
1%
Vitamin B5
0.032mg
1%
Protein per 100 calories
2.8g
3.8g
N/A
Calories per 10 g protein
359kcal
261kcal
N/A
Weight per 100 calories
714g
99g
N/A
Net carbs
3.61g
17.06g
N/A
Sodium
7mg
8mg
0%
Vitamin A
3µg
0µg
0%
Vitamin B6
0.096mg
0.097mg
0%
Tryptophan
0.041mg
0%
Threonine
0.149mg
0%
Isoleucine
0.146mg
0%
Leucine
0.311mg
0%
Lysine
0.109mg
0%
Methionine
0.125mg
0%
Phenylalanine
0.203mg
0%
Valine
0.2mg
0%
Histidine
0.088mg
0%
Macronutrient Comparison
Macronutrient breakdown side-by-side comparison
2
4%
95%
Protein:
0.39 g
Fats:
0.04 g
Carbs:
3.61 g
Water:
94.5 g
Other:
1.46 g
3
4%
20%
75%
Protein:
3.87 g
Fats:
0.65 g
Carbs:
19.86 g
Water:
74.93 g
Other:
0.69 g
Contains
more
Water Water
+26.1%
Contains
more
Other Other
+111.6%
Contains
more
Protein Protein
+892.3%
Contains
more
Fats Fats
+1525%
Contains
more
Carbs Carbs
+450.1%