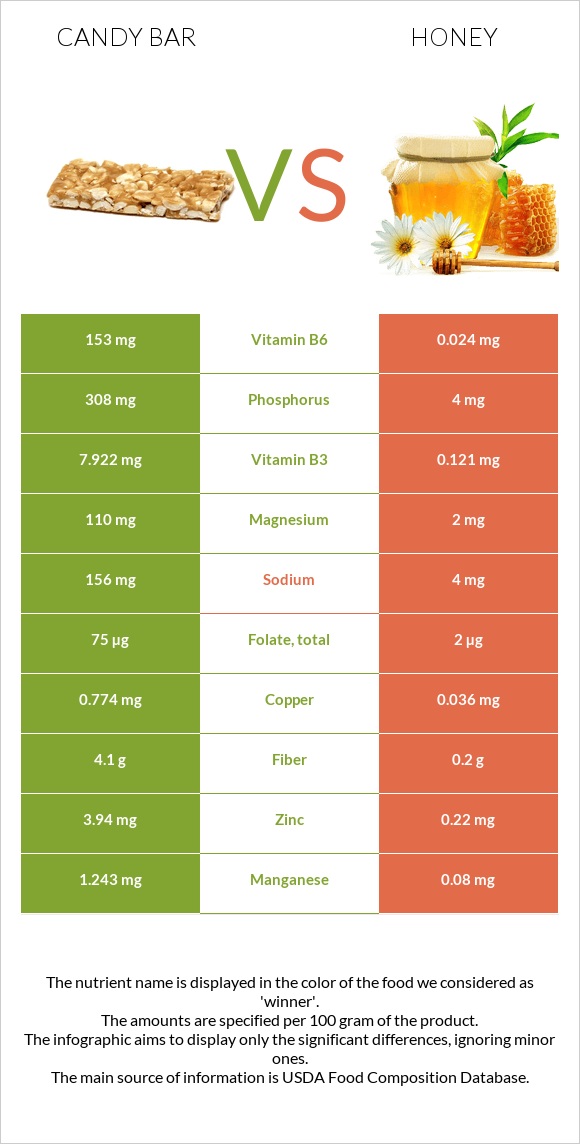
Summary of differences between candy bar and honey Honey has less vitamin B6, copper, manganese, vitamin B3, phosphorus, zinc, vitamin E, magnesium, and folate than candy bar. Candy bar covers your daily need for vitamin B6, 11767% more than honey. Honey has less saturated fat. These are the specific foods used in this comparison Candies, peanut bar and Honey .
Infographic
Mineral Comparison
Mineral comparison score is based on the number of minerals by which one or the other food is richer. The "coverage" charts below show how much of the daily needs can be covered by 300 grams of the food.
9
100 g
300 g
1 oz - 28.35g 1 bar (1.4 oz) - 40g 1 bar (1.6 oz) - 45g 1 bar (1.75 fl oz) - 50g
Magnesium
Magnesium
Calcium
Calcium
Potassium
Potassium
Iron
Iron
Copper
Copper
Zinc
Zinc
Phosphorus
Phosphorus
Sodium
Sodium
Manganese
Manganese
Selenium
Selenium
79%
23%
36%
36%
258%
107%
132%
20%
162%
26%
1
100 g
300 g
1 packet (0.5 oz) - 14g 1 tbsp - 21g 1 cup - 339g
Magnesium
Magnesium
Calcium
Calcium
Potassium
Potassium
Iron
Iron
Copper
Copper
Zinc
Zinc
Phosphorus
Phosphorus
Sodium
Sodium
Manganese
Manganese
Selenium
Selenium
1.4%
1.8%
4.6%
16%
12%
6%
1.7%
0.52%
10%
4.4%
Vitamin Comparison
Vitamin comparison score is based on the number of vitamins by which one or the other food is richer. The "coverage" charts below show how much of the daily needs can be covered by 300 grams of the food.
7
100 g
300 g
1 oz - 28.35g 1 bar (1.4 oz) - 40g 1 bar (1.6 oz) - 45g 1 bar (1.75 fl oz) - 50g
Vitamin C
Vit. C
Vitamin D
Vit. D
Vitamin A
Vit. A
Vitamin E
Vit. E
Vitamin B1
Vit. B1
Vitamin B2
Vit. B2
Vitamin B3
Vit. B3
Vitamin B5
Vit. B5
Vitamin B6
Vit. B6
Vitamin B12
Vit. B12
Vitamin K
Vit. K
Folate
Folate
0%
0%
0%
82%
25%
32%
149%
50%
35308%
0%
0%
56%
1
100 g
300 g
1 packet (0.5 oz) - 14g 1 tbsp - 21g 1 cup - 339g
Vitamin C
Vit. C
Vitamin D
Vit. D
Vitamin A
Vit. A
Vitamin E
Vit. E
Vitamin B1
Vit. B1
Vitamin B2
Vit. B2
Vitamin B3
Vit. B3
Vitamin B5
Vit. B5
Vitamin B6
Vit. B6
Vitamin B12
Vit. B12
Vitamin K
Vit. K
Folate
Folate
1.7%
0%
0%
0%
0%
8.8%
2.3%
4.1%
5.5%
0%
0%
1.5%
All nutrients comparison - raw data values
Nutrient
DV% diff.
Vitamin B6
153mg
0.024mg
11767%
Copper
0.774mg
0.036mg
82%
Polyunsaturated fat
10.65g
0g
71%
Fats
33.7g
0g
52%
Manganese
1.243mg
0.08mg
51%
Fructose
40.94g
51%
Vitamin B3
7.922mg
0.121mg
49%
Phosphorus
308mg
4mg
43%
Monounsaturated fat
16.721g
0g
42%
Zinc
3.94mg
0.22mg
34%
Protein
15.5g
0.3g
30%
Vitamin E
4.1mg
0mg
27%
Magnesium
110mg
2mg
26%
Saturated fat
4.678g
0g
21%
Folate
75µg
2µg
18%
Fiber
4.1g
0.2g
16%
Vitamin B5
0.83mg
0.068mg
15%
Carbs
47.4g
82.4g
12%
Calories
522kcal
304kcal
11%
Potassium
407mg
52mg
10%
Vitamin B1
0.1mg
0mg
8%
Vitamin B2
0.14mg
0.038mg
8%
Calcium
78mg
6mg
7%
Iron
0.97mg
0.42mg
7%
Sodium
156mg
4mg
7%
Selenium
4.7µg
0.8µg
7%
Choline
29.4mg
2.2mg
5%
Vitamin C
0mg
0.5mg
1%
Protein per 100 calories
3g
0.1g
N/A
Calories per 10 g protein
337kcal
10133kcal
N/A
Weight per 100 calories
19g
33g
N/A
Unsaturated / Saturated Fat ratio
5.9
N/A
Net carbs
43.3g
82.2g
N/A
Sugar
42.22g
82.12g
N/A
Tryptophan
0.149mg
0.004mg
0%
Threonine
0.52mg
0.004mg
0%
Isoleucine
0.534mg
0.008mg
0%
Leucine
0.986mg
0.01mg
0%
Lysine
0.545mg
0.008mg
0%
Methionine
0.185mg
0.001mg
0%
Phenylalanine
0.787mg
0.011mg
0%
Valine
0.638mg
0.009mg
0%
Histidine
0.385mg
0.001mg
0%
Macronutrient Comparison
Macronutrient breakdown side-by-side comparison
3
16%
34%
47%
2%
Protein:
15.5 g
Fats:
33.7 g
Carbs:
47.4 g
Water:
1.6 g
Other:
1.8 g
2
82%
17%
Protein:
0.3 g
Fats:
0 g
Carbs:
82.4 g
Water:
17.1 g
Other:
0.2 g
Contains
more
Protein Protein
+5066.7%
Contains
more
Fats Fats
+∞%
Contains
more
Other Other
+800%
Contains
more
Carbs Carbs
+73.8%
Contains
more
Water Water
+968.8%