Honey Nutrition: Complete Data of All Nutrients

Summary
Around 95% of honey’s dry weight is comprised of simple sugars, mainly fructose and glucose. Honey also contains small amounts of protein, vitamins, minerals, and various health-beneficial phytochemicals.
Introduction
Honey is one of the most popular natural sweeteners worldwide. Traditional medicine is often used for its protective and healthful qualities. In this article, we will delve into the nutritional properties of honey and discuss its components in detail.
Table of contents
Nutrition
This article will mainly focus on the nutrition of 100g of commercial honey while also mentioning key distinctions of raw honey. (1).
One average serving size of honey is one tablespoon, equal to 21g.
Other serving sizes include one teaspoon, equal to 7g, one packet or half an ounce, weighing 14g, and one cup containing 339g of honey.
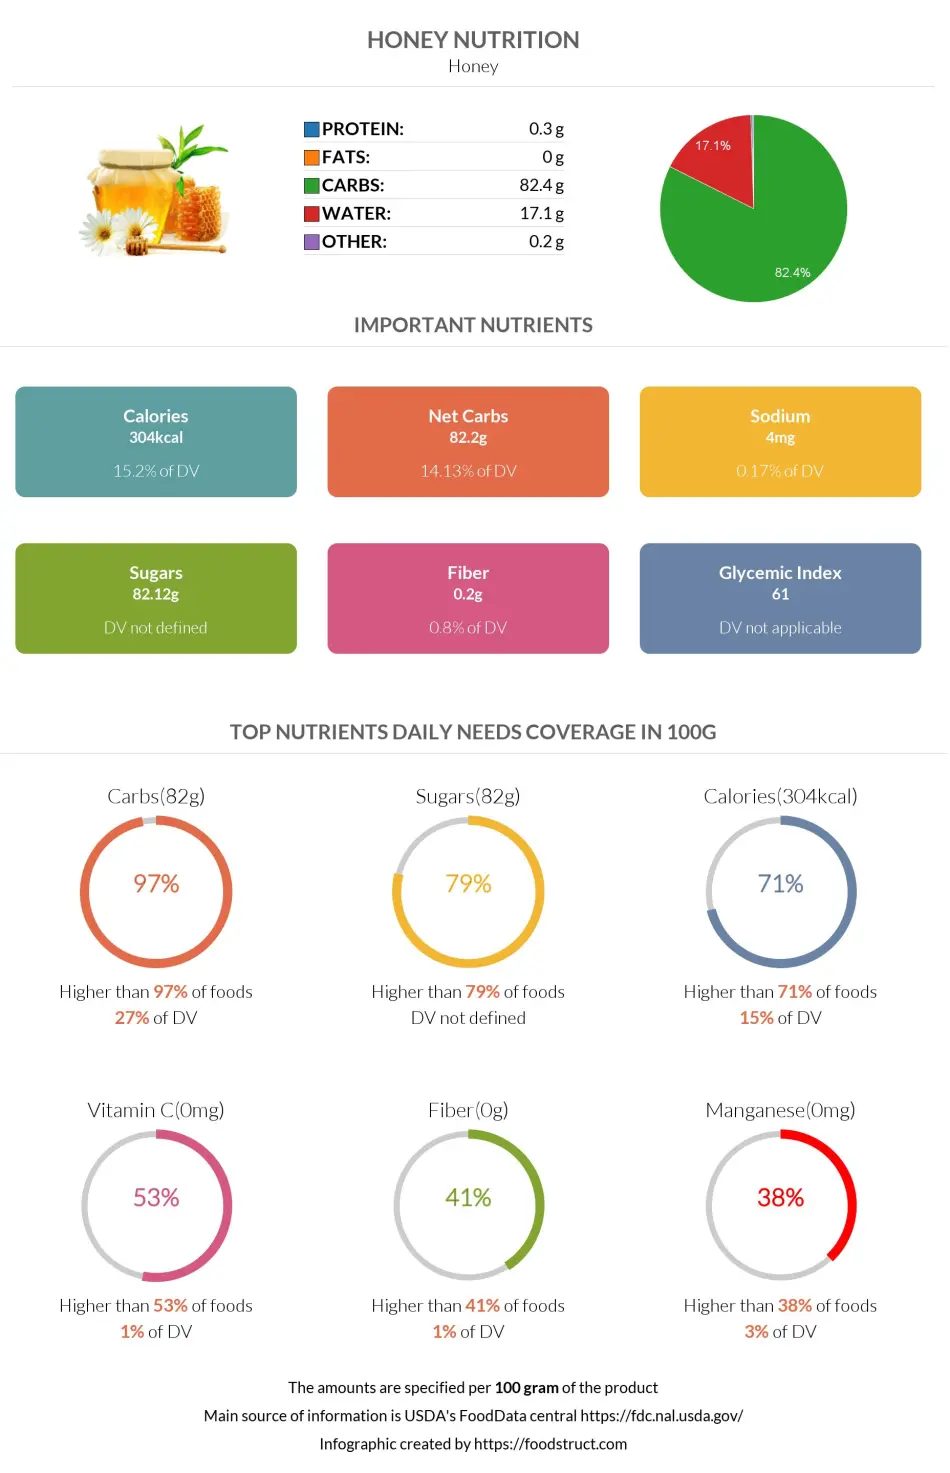
Honey’s nutrient content consists of 82% carbs, 17% water, and less than 1% other nutrients.
Macronutrients chart
Calories
The unusually rich carbohydrate content of honey makes it a higher-than-average calorie product. One hundred grams of honey provides 304 calories.
We compared honey to all foods in our database and found it is in the top 29% percent of foods high in calories. So, 71% of foods contain fewer calories than honey does.
Calories per Serving
It is necessary to mention that honey is rarely used in such large amounts.
One tablespoon contains roughly 21 grams of honey and 64 calories accordingly. A teaspoon of honey contains only 21 calories.
Burning Estimates
In the table below, we have calculated which duration of a specific workout will burn the number of calories (64kcal) provided by one tablespoon of honey, using a method called MET or Metabolic Equivalent of a Task (2, 3).
The burning estimates naturally vary based on body weight. We present calculations for a 70kg and a 100kg person.
| 70kg person | 100kg person | |
| Walking | 13 min | 9 min |
| Running | 5 min | 3 min |
| Cycling | 5 min | 3 min |
| Dancing | 7 min | 5 min |
In the following table, you can see the number of minutes a person weighing 70kg would need to walk to burn the calories provided by different serving sizes of honey.
| Serving Size | Calories | Walking minutes to burn the calories |
| 100g | 304kcal | ~1 hour |
| 1 tablespoon (21g) | 64kcal | 13 minutes |
| 1 teaspoon (7g) | 21kcal | 4 minutes |
Carbohydrates
As expected, honey has a very high carbohydrate content. About 95 to 97% of honey’s dry weight is comprised of carbohydrates.
A 100g serving of honey, equalling around 5tbsp, contains 82.2g of carbohydrates.
This puts honey in the top 2% of foods in our database as a source of carbohydrates.
Five tablespoons of honey provide 27% of the recommended daily value of carbohydrates.
While the difference is not outstanding, raw honey tends to be slightly lower in carbohydrates, containing 81g per 100g serving.
Due to this high carbohydrate content, honey can be an excellent energy source for athletes (4).
Carbohydrates per Serving
One average serving size of honey per person is 1 tbsp, weighing 21g. The average serving size of honey provides 17.3g of carbohydrates.
One teaspoon of honey weighs 7g on average. This means you’re consuming almost 6g of carbs when eating a teaspoon of honey.
Dietary Fiber
Honey consists of 99.8% of net carbs, containing 82.1g of net carbs and only 0.2g of dietary fiber.
Fiber content ratio for Honey
Sugars
The sugar content of honey consists predominantly of fructose (50%) and glucose (44%).
Honey also contains smaller amounts of sugars such as sucrose, maltose, and galactose.
Carbohydrate type breakdown
Raw honey is also lower in sugars, containing 76g per 100g serving.
FODMAPs
FODMAPs (fermentable oligosaccharides, disaccharides, monosaccharides, and polyols) are carbohydrates that are poorly absorbed in the small intestine.
Fructose is a monosaccharide that is only partially absorbed in the small intestine, while the rest is fermented by gut microbiota. Thus, honey is considered a high-FODMAP food.
FODMAPs are safe for most people; however, people with Crohn’s disease and ulcerative colitis, IBS, and other functional gastrointestinal disorders should avoid high FODMAP foods, as they may trigger or worsen the symptoms (5, 6).
Only one tablespoon of honey may be considered to be low in FODMAPs.
Protein
Honey contains negligible protein - less than half a gram per 100g serving.
This low content includes free amino acids and enzymes, such as diastase, invertase, and glucose oxidase. These enzymes help break down the carbohydrates of honey (7).
The main free amino acid of honey is the non-essential proline, making up about 50% of the total amino acid content (7).
Protein quality breakdown
Fats
Honey is entirely absent in fats.
Vitamins
Honey is relatively low in vitamins overall.
The vitamin found in the highest amount is vitamin C, with 0.5mg per 100g serving. However, this only covers 1% of the daily needed value of this vitamin.
Honey also contains small amounts of vitamins B2, B3, B5, and B6 and the folate form of vitamin B9.
Honey completely lacks fat-soluble vitamins A, D, E, and K and water-soluble vitamins B1 and B12.
Vitamin coverage chart
Minerals
Honey contains most minerals but in small quantities. It can not be considered a good source of minerals, considering the small serving sizes of honey.
Honey is relatively rich in iron and manganese. It also contains low levels of zinc, selenium, copper, calcium, potassium, magnesium, and phosphorus.
Honey is low in sodium, containing only 4mg per 100g serving.
Essential trace components can also be found in honey, including silicon, rubidium, vanadium, zirconium, lithium, and strontium. However, some heavy metals such as lead, cadmium, and arsenic are present as pollutants (8).
Mineral coverage chart
Phytochemicals
The nutritional content of honey is not only determined by its well-known nutrients but also by various phytochemicals or phytonutrients. These compounds are found in small amounts but can play a significant role in the biomedical properties of honey.
Polyphenols
Phenolic compounds are naturally strong antioxidants that help prevent cell damage caused by oxidative stress. They are the predominant phytochemicals influencing honey's therapeutic value.
The two predominant polyphenolic compounds in honey are flavonoids and phenolic acids. Nearly thirty types of polyphenols can be found in honey. These vary greatly depending on the floral source and production conditions but usually include galangin, quercetin, kaempferol, luteolin, and isorhamnetin (8).
According to studies, honey polyphenols are highly bioavailable or absorbable, as honey lacks the food matrix and is not exposed to chemical reactions such as extraction or decoction. (9).
Honey phenolic compounds help fight microbial infections and may reduce the risk of developing cancer and heart disease. Honey may reduce plasma levels of fructosamine, glycosylated hemoglobin, and glucose in patients with diabetes (10).
Organic Acids
The primary organic acid found in honey is the product of glucose oxidation, gluconic acid. Other organic acids include acetic, formic, and citric acids (8). These compounds give honey its acidic quality.
Volatile Compounds
The volatile compounds found in honey are low in amount but large in variety. These include aldehydes, alcohols, hydrocarbons, ketones, acid esters, benzene and terpene and their derivatives, pyran, sulfur, furan, and cyclic compounds (8).
These compounds are often responsible for the aroma and physical characteristics of honey.
Glycemic Index
The glycemic index of honey differs based on its variety. Yellow box honey with 46% fructose has a glycemic index of 35, while this value for tupelo honey, with a high fructose-to-glucose ratio, can go up to 74 (11).
Based on 17 types of honey, the mean glycemic index has been calculated to be 60. This puts honey’s glycemic index value in the moderate category, despite its high carbohydrate content.
Glycemic Load
Glycemic load is a calculated number showing how much a food will raise one’s blood glucose levels after consumption.
Insulin Index
The insulin index of a given food shows how much it raises the insulin level in the blood after consumption.
Honey has been researched to have an insulin index value falling from 40 to 67, depending on the variety (12).
A commercial blend of honey was found to have an insulin index of 62 ± 4 (12). This puts the insulin index of honey in the moderate category as well.
Acidity
Depending on the variety, honey was found to have a pH value falling in the range of 3.67 to 4.11 (13). This shows honey to be acidic.
Besides the pH value, the acidity of foods can also be measured by the potential renal acid load or PRAL. The PRAL value demonstrates how much acid or base the food forms in the body.
Honey has a PRAL value of -0.9, making it slightly alkaline-forming.
Comparison to Similar Foods
In the table below, you can see how honey compares to other sweeteners regarding carbohydrate content.
| Food | Carbohydrates per serving | Carbohydrates per 100g |
| Honey | 17g | 82g |
| Maple Syrup | 56g (¼ cup or 83g) | 67g |
| Agave Nectar | 42g (¼ cup or 55g) | 76g |
| Brown Sugar | 4g (1tsp or 4.2g) | 98g |
| Sugar | 4g (1tsp or 4.2g) | 100g |
Compared to maple syrup, honey contains more carbohydrates, protein, and calories. Honey also has a higher glycemic index. To read a full nutrition and health impact comparison of honey and maple syrup, you can visit this page.
Agave nectar is higher in calories and fats, while honey is higher in carbohydrates and protein. However, the average serving size of agave nectar is over double that of honey. If interested, you can also read the complete comparison of “Agave Nectar vs. Honey.”
Compared to granulated sugar, honey is lower in net carbs and calories while containing more fructose, minerals, and vitamins.
References
- https://fdc.nal.usda.gov/fdc-app.html#/food-details/454314/nutrients
- https://www.ncbi.nlm.nih.gov/pmc/articles/PMC4428382/
- 2011 Compendium of Physical Activities
- https://www.ncbi.nlm.nih.gov/pmc/articles/PMC6683082/
- https://www.ncbi.nlm.nih.gov/pmc/articles/PMC3934501/
- https://www.ncbi.nlm.nih.gov/pmc/articles/PMC4918736
- https://www.researchgate.net/publication/224906029
- https://www.ncbi.nlm.nih.gov/pmc/articles/PMC5424551/
- https://www.ncbi.nlm.nih.gov/pmc/articles/PMC7807510
- https://www.ncbi.nlm.nih.gov/pmc/articles/PMC6225430/
- https://academic.oup.com/ajcn/article/114/5/1625/6320814
- https://www.researchgate.net/publication/236880818
- https://core.ac.uk/download/pdf/81170038.pdf

Top nutrition facts for Honey
| Calories ⓘ Calories for selected serving | 304 kcal |
|
Glycemic index ⓘ
Source:
Check out our Glycemic index chart page for the full list.
|
61 (medium) |
| Glycemic load ⓘ Glycemic Load (GL) is a metric that measures both the quality (Glycemic Index) and quantity of carbohydrates in a specific serving of food to estimate its impact on blood sugar levels. It is calculated as: (GI × Carbs in grams) / 100. | 11 (medium) |
| Insulin index ⓘ The insulin index of foods demonstrates how much a food increases the insulin level in the blood, in the first two-hour period after consumption. | 62 ⓘ https://www.researchgate.net/publication/236880818 – II values for 8 types of honey range between 40 and 67 |
| Net carbs ⓘ Net Carbs = Total Carbohydrates – Fiber – Sugar Alcohols | 82 g |
| Default serving size ⓘ Serving sizes are mostly taken from FDA's Reference Amounts Customarily Consumed (RACCs) | 1 tbsp (21 g) |
| Acidity (Based on PRAL) ⓘ PRAL (Potential renal acid load) is calculated using a formula. On the PRAL scale the higher the positive value, the more is the acidifying effect on the body. The lower the negative value, the higher the alkalinity of the food. 0 is neutral. | -0.9 (alkaline) |
| Oxalates | 4 mg ⓘ https://www.semanticscholar.org/paper/Anti-nutritional-Composition-of-Honey-Samples-from-Oriolowo-John/be571e923385e78ae00b8cfe4e95f7e8ad522a17 |
Honey calories (kcal)
| Calories for different serving sizes of honey | Calories | Weight |
|---|---|---|
| Calories in 100 grams | 304 | |
| Calories in 1 tbsp | 64 | 21 g |
| Calories in 1 cup | 1031 | 339 g |
Extra Nutrition facts for Honey
| Weight per 100 calories ⓘ Shows how many grams of this food equal 100 kcal—higher grams mean a larger portion for the same calories. | 33 g |
| Processing score ⓘ The processing score is a calculated value that looks at both how industrially made it is (NOVA) and how healthy/unprocessed the ingredients are (SIGA), then combines them into one score from 1 (least processed) to 4 (most processed). | 1.7 - Minimally processed ⓘ NOVA score = 2, SIGA score = A1 |
Honey Glycemic index (GI)
Honey Glycemic load (GL)
Mineral chart - relative view
Vitamin chart - relative view
All nutrients for Honey per 100g
| Nutrient | Value | DV% | In TOP % of foods | Comparison |
| Vitamin A | 0µg | 0% | 100% | |
| Calories | 304kcal | 15% | 30% |
6.5 times more than Orange
|
| Weight per 100 calories | 33g | N/A | 71% | |
| Protein | 0.3g | 1% | 93% |
9.4 times less than Broccoli
|
| Fats | 0g | 0% | 100% |
N/A
|
| Vitamin C | 0.5mg | 1% | 38% |
106 times less than Lemon
|
| Carbs | 82g | 27% | 3% |
2.9 times more than Rice
|
| Net carbs | 82g | N/A | 2% |
1.5 times more than Chocolate
|
| Cholesterol | 0mg | 0% | 100% |
N/A
|
| Vitamin D* | 0 IU | 0% | 100% |
N/A
|
| Vitamin D | 0µg | 0% | 100% |
N/A
|
| Magnesium | 2mg | 0% | 88% |
70 times less than Almonds
|
| Calcium | 6mg | 1% | 85% |
20.8 times less than Milk
|
| Potassium | 52mg | 2% | 87% |
2.8 times less than Cucumber
|
| Iron | 0.42mg | 5% | 78% |
6.2 times less than Beef broiled
|
| Sugar | 82g | N/A | 1% |
9.2 times more than Coca-Cola
|
| Fiber | 0.2g | 1% | 53% |
12 times less than Orange
|
| Copper | 0.04mg | 4% | 73% |
3.9 times less than Shiitake
|
| Zinc | 0.22mg | 2% | 76% |
28.7 times less than Beef broiled
|
| Phosphorus | 4mg | 1% | 90% |
45.5 times less than Chicken meat
|
| Sodium | 4mg | 0% | 92% |
122.5 times less than White bread
|
| Vitamin E | 0mg | 0% | 100% |
N/A
|
| Manganese | 0.08mg | 3% | 38% | |
| Selenium | 0.8µg | 1% | 65% | |
| Vitamin B1 | 0mg | 0% | 100% |
N/A
|
| Vitamin B2 | 0.04mg | 3% | 78% |
3.4 times less than Avocado
|
| Vitamin B3 | 0.12mg | 1% | 84% |
79.1 times less than Turkey meat
|
| Vitamin B5 | 0.07mg | 1% | 67% |
16.6 times less than Sunflower seeds
|
| Vitamin B6 | 0.02mg | 2% | 79% |
5 times less than Oats
|
| Vitamin B12 | 0µg | 0% | 100% |
N/A
|
| Vitamin K | 0µg | 0% | 100% |
N/A
|
| Folate | 2µg | 1% | 76% |
30.5 times less than Brussels sprouts
|
| Choline | 2.2mg | 0% | 50% | |
| Saturated fat | 0g | 0% | 100% |
N/A
|
| Monounsaturated fat | 0g | N/A | 100% |
N/A
|
| Polyunsaturated fat | 0g | N/A | 100% |
N/A
|
| Tryptophan | 0mg | 0% | 56% |
76.3 times less than Chicken meat
|
| Threonine | 0mg | 0% | 58% |
180 times less than Beef broiled
|
| Isoleucine | 0.01mg | 0% | 57% |
114.3 times less than Salmon raw
|
| Leucine | 0.01mg | 0% | 58% |
243.1 times less than Tuna Bluefin
|
| Lysine | 0.01mg | 0% | 58% |
56.5 times less than Tofu
|
| Methionine | 0mg | 0% | 58% |
96 times less than Quinoa
|
| Phenylalanine | 0.01mg | 0% | 57% |
60.7 times less than Egg
|
| Valine | 0.01mg | 0% | 58% |
225.4 times less than Soybean raw
|
| Histidine | 0mg | 0% | 58% |
749 times less than Turkey meat
|
| Fructose | 41g | 51% | 1% |
6.9 times more than Apple
|
| Caffeine | 0mg | 0% | 100% | |
| Omega-3 - EPA | 0g | N/A | 100% |
N/A
|
| Omega-3 - DHA | 0g | N/A | 100% |
N/A
|
| Omega-3 - DPA | 0g | N/A | 100% |
N/A
|
Check out similar food or compare with current
NUTRITION FACTS LABEL
Serving Size ______________
Health checks
Honey nutrition infographic
References
All the values for which the sources are not specified explicitly are taken from FDA’s Food Central. The exact link to the food presented on this page can be found below.