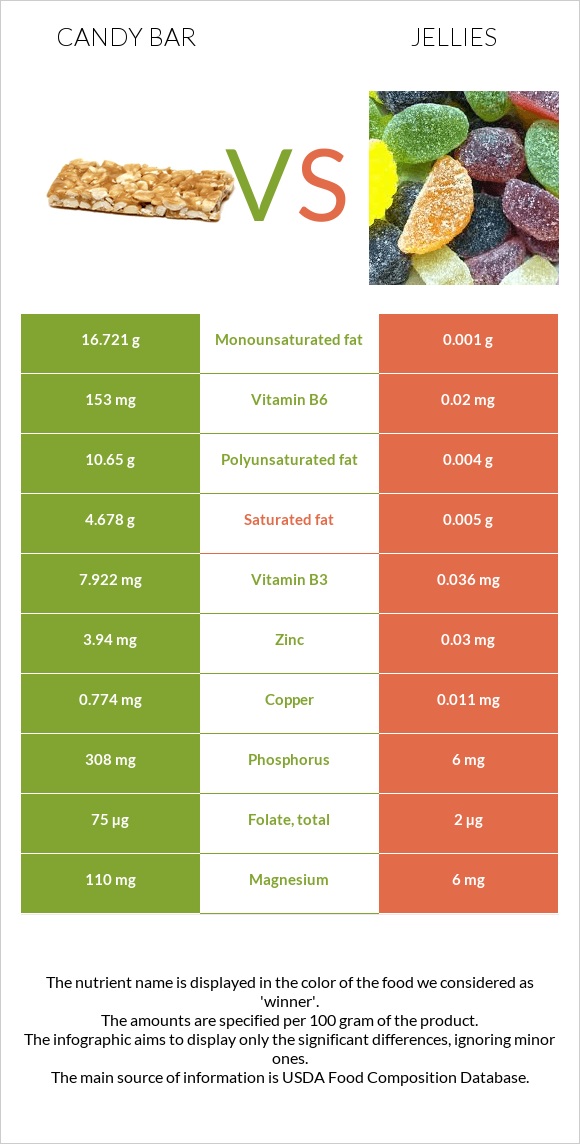
What are the differences between candy bar and jellies? Candy bar is richer than jellies in vitamin B6, copper, vitamin B3, manganese, phosphorus, zinc, vitamin E, magnesium, and folate. Candy bar's daily need coverage for vitamin B6 is 11768% more. The amount of saturated fat in jellies is lower. We used Candies, peanut bar and Jellies types in this article.
Infographic
Mineral Comparison
Mineral comparison score is based on the number of minerals by which one or the other food is richer. The "coverage" charts below show how much of the daily needs can be covered by 300 grams of the food.
9
100 g
300 g
1 oz - 28.35g 1 bar (1.4 oz) - 40g 1 bar (1.6 oz) - 45g 1 bar (1.75 fl oz) - 50g
Magnesium
Magnesium
Calcium
Calcium
Potassium
Potassium
Iron
Iron
Copper
Copper
Zinc
Zinc
Phosphorus
Phosphorus
Sodium
Sodium
Manganese
Manganese
Selenium
Selenium
79%
23%
36%
36%
258%
107%
132%
20%
162%
26%
1
100 g
300 g
1 packet (0.5 oz) - 14g 1 serving 1 tbsp - 21g
Magnesium
Magnesium
Calcium
Calcium
Potassium
Potassium
Iron
Iron
Copper
Copper
Zinc
Zinc
Phosphorus
Phosphorus
Sodium
Sodium
Manganese
Manganese
Selenium
Selenium
4.3%
2.1%
4.8%
7.1%
3.7%
0.82%
2.6%
3.9%
17%
2.2%
Vitamin Comparison
Vitamin comparison score is based on the number of vitamins by which one or the other food is richer. The "coverage" charts below show how much of the daily needs can be covered by 300 grams of the food.
7
100 g
300 g
1 oz - 28.35g 1 bar (1.4 oz) - 40g 1 bar (1.6 oz) - 45g 1 bar (1.75 fl oz) - 50g
Vitamin C
Vit. C
Vitamin D
Vit. D
Vitamin A
Vit. A
Vitamin E
Vit. E
Vitamin B1
Vit. B1
Vitamin B2
Vit. B2
Vitamin B3
Vit. B3
Vitamin B5
Vit. B5
Vitamin B6
Vit. B6
Vitamin B12
Vit. B12
Vitamin K
Vit. K
Folate
Folate
0%
0%
0%
82%
25%
32%
149%
50%
35308%
0%
0%
56%
2
100 g
300 g
1 packet (0.5 oz) - 14g 1 serving 1 tbsp - 21g
Vitamin C
Vit. C
Vitamin D
Vit. D
Vitamin A
Vit. A
Vitamin E
Vit. E
Vitamin B1
Vit. B1
Vitamin B2
Vit. B2
Vitamin B3
Vit. B3
Vitamin B5
Vit. B5
Vitamin B6
Vit. B6
Vitamin B12
Vit. B12
Vitamin K
Vit. K
Folate
Folate
3%
0%
0%
0%
0.25%
6%
0.68%
12%
4.6%
0%
0.75%
1.5%
All nutrients comparison - raw data values
Nutrient
DV% diff.
Vitamin B6
153mg
0.02mg
11768%
Copper
0.774mg
0.011mg
85%
Polyunsaturated fat
10.65g
0.004g
71%
Fats
33.7g
0.02g
52%
Vitamin B3
7.922mg
0.036mg
49%
Manganese
1.243mg
0.132mg
48%
Phosphorus
308mg
6mg
43%
Monounsaturated fat
16.721g
0.001g
42%
Zinc
3.94mg
0.03mg
36%
Protein
15.5g
0.15g
31%
Vitamin E
4.1mg
0mg
27%
Magnesium
110mg
6mg
25%
Saturated fat
4.678g
0.005g
21%
Folate
75µg
2µg
18%
Calories
522kcal
266kcal
13%
Vitamin B5
0.83mg
0.197mg
13%
Fiber
4.1g
1g
12%
Potassium
407mg
54mg
10%
Iron
0.97mg
0.19mg
10%
Vitamin B2
0.14mg
0.026mg
9%
Carbs
47.4g
69.95g
8%
Selenium
4.7µg
0.4µg
8%
Vitamin B1
0.1mg
0.001mg
8%
Calcium
78mg
7mg
7%
Sodium
156mg
30mg
5%
Choline
29.4mg
10.3mg
3%
Vitamin C
0mg
0.9mg
1%
Protein per 100 calories
3g
0.06g
N/A
Calories per 10 g protein
337kcal
17733kcal
N/A
Weight per 100 calories
19g
38g
N/A
Unsaturated / Saturated Fat ratio
5.9
1
N/A
Net carbs
43.3g
68.95g
N/A
Sugar
42.22g
51.22g
N/A
Vitamin K
0µg
0.3µg
0%
Tryptophan
0.149mg
0%
Threonine
0.52mg
0%
Isoleucine
0.534mg
0%
Leucine
0.986mg
0%
Lysine
0.545mg
0%
Methionine
0.185mg
0%
Phenylalanine
0.787mg
0%
Valine
0.638mg
0%
Histidine
0.385mg
0%
Macronutrient Comparison
Macronutrient breakdown side-by-side comparison
3
16%
34%
47%
2%
Protein:
15.5 g
Fats:
33.7 g
Carbs:
47.4 g
Water:
1.6 g
Other:
1.8 g
2
70%
30%
Protein:
0.15 g
Fats:
0.02 g
Carbs:
69.95 g
Water:
29.77 g
Other:
0.11 g
Contains
more
Protein Protein
+10233.3%
Contains
more
Fats Fats
+168400%
Contains
more
Other Other
+1536.4%
Contains
more
Carbs Carbs
+47.6%
Contains
more
Water Water
+1760.6%
Fat Type Comparison
Fat type breakdown side-by-side comparison
2
15%
52%
33%
Saturated fat:
Sat. Fat
4.678 g
Monounsaturated fat:
Mono. Fat
16.721 g
Polyunsaturated fat:
Poly. Fat
10.65 g
1
50%
10%
40%
Saturated fat:
Sat. Fat
0.005 g
Monounsaturated fat:
Mono. Fat
0.001 g
Polyunsaturated fat:
Poly. Fat
0.004 g
Contains
more
Mono. Fat Monounsaturated fat
+1672000%
Contains
more
Poly. Fat Polyunsaturated fat
+266150%
Contains
less
Sat. Fat Saturated fat
-99.9%