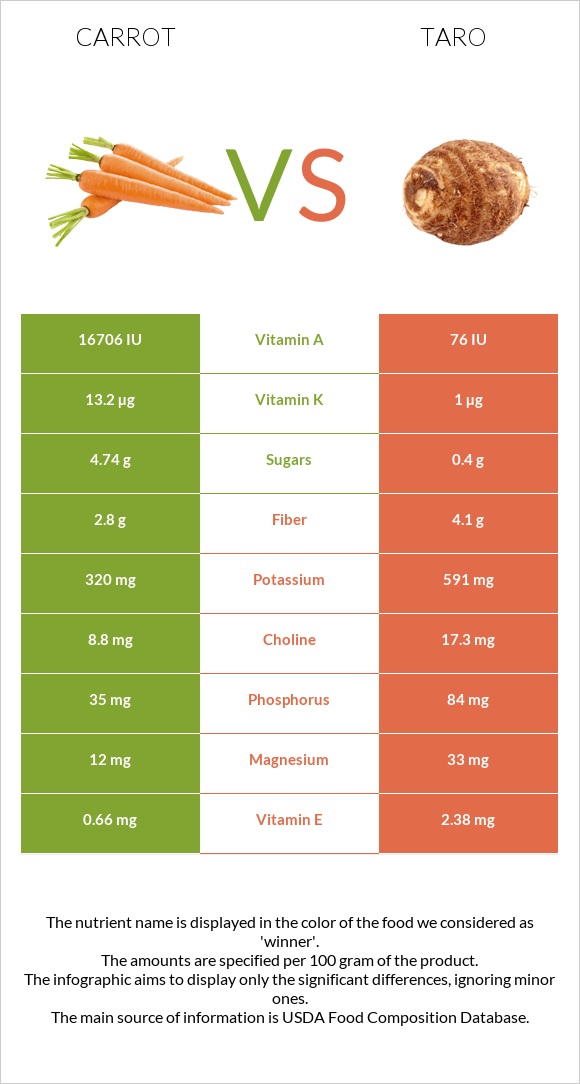
Important differences between carrots and taro Carrots have more vitamin A and vitamin K; however, taro has more copper, vitamin E, vitamin B6, manganese, potassium, phosphorus, and fiber. Carrots' daily need coverage for vitamin A is 333% more. Carrots have 13 times more vitamin K than taro. Carrots have 13.2µg of vitamin K, while taro has 1µg. Taro has a higher glycemic index than carrots. The food varieties used in the comparison are Carrots, raw and Taro, raw .
Infographic
Mineral Comparison
Mineral comparison score is based on the number of minerals by which one or the other food is richer. The "coverage" charts below show how much of the daily needs can be covered by 300 grams of the food.
0
100 g
300 g
1 slice - 3g 1 strip medium - 4g 1 strip large (3" long) - 7g 1 small (5-1/2" long) - 50g 1 medium - 61g 1 large (7-1/4" to 8-/1/2" long) - 72g 1 cup grated - 110g 1 cup strips or slices - 122g 1 cup chopped - 128g
Magnesium
Magnesium
Calcium
Calcium
Potassium
Potassium
Iron
Iron
Copper
Copper
Zinc
Zinc
Phosphorus
Phosphorus
Sodium
Sodium
Manganese
Manganese
Selenium
Selenium
8.6%
9.9%
28%
11%
15%
6.5%
15%
9%
19%
0.55%
9
100 g
300 g
1 cup, sliced - 104g
Magnesium
Magnesium
Calcium
Calcium
Potassium
Potassium
Iron
Iron
Copper
Copper
Zinc
Zinc
Phosphorus
Phosphorus
Sodium
Sodium
Manganese
Manganese
Selenium
Selenium
24%
13%
52%
21%
57%
6.3%
36%
1.4%
50%
3.8%
Vitamin Comparison
Vitamin comparison score is based on the number of vitamins by which one or the other food is richer. The "coverage" charts below show how much of the daily needs can be covered by 300 grams of the food.
5
100 g
300 g
1 slice - 3g 1 strip medium - 4g 1 strip large (3" long) - 7g 1 small (5-1/2" long) - 50g 1 medium - 61g 1 large (7-1/4" to 8-/1/2" long) - 72g 1 cup grated - 110g 1 cup strips or slices - 122g 1 cup chopped - 128g
Vitamin C
Vit. C
Vitamin D
Vit. D
Vitamin A
Vit. A
Vitamin E
Vit. E
Vitamin B1
Vit. B1
Vitamin B2
Vit. B2
Vitamin B3
Vit. B3
Vitamin B5
Vit. B5
Vitamin B6
Vit. B6
Vitamin B12
Vit. B12
Vitamin K
Vit. K
Folate
Folate
20%
0%
278%
13%
17%
13%
18%
16%
32%
0%
33%
14%
5
100 g
300 g
1 cup, sliced - 104g
Vitamin C
Vit. C
Vitamin D
Vit. D
Vitamin A
Vit. A
Vitamin E
Vit. E
Vitamin B1
Vit. B1
Vitamin B2
Vit. B2
Vitamin B3
Vit. B3
Vitamin B5
Vit. B5
Vitamin B6
Vit. B6
Vitamin B12
Vit. B12
Vitamin K
Vit. K
Folate
Folate
15%
0%
1.3%
48%
24%
5.8%
11%
18%
65%
0%
2.5%
17%
All nutrients comparison - raw data values
Nutrient
DV% diff.
Vitamin A
835µg
4µg
92%
Copper
0.045mg
0.172mg
14%
Vitamin E
0.66mg
2.38mg
11%
Vitamin B6
0.138mg
0.283mg
11%
Manganese
0.143mg
0.383mg
10%
Vitamin K
13.2µg
1µg
10%
Potassium
320mg
591mg
8%
Phosphorus
35mg
84mg
7%
Carbs
9.58g
26.46g
6%
Magnesium
12mg
33mg
5%
Fiber
2.8g
4.1g
5%
Calories
41kcal
112kcal
4%
Iron
0.3mg
0.55mg
3%
Sodium
69mg
11mg
3%
Vitamin B2
0.058mg
0.025mg
3%
Vitamin C
5.9mg
4.5mg
2%
Vitamin B1
0.066mg
0.095mg
2%
Vitamin B3
0.983mg
0.6mg
2%
Choline
8.8mg
17.3mg
2%
Protein
0.93g
1.5g
1%
Calcium
33mg
43mg
1%
Starch
1.43g
1%
Selenium
0.1µg
0.7µg
1%
Vitamin B5
0.273mg
0.303mg
1%
Folate
19µg
22µg
1%
Fructose
0.55g
1%
Protein per 100 calories
2.3g
1.3g
N/A
Calories per 10 g protein
441kcal
747kcal
N/A
Weight per 100 calories
244g
89g
N/A
Fats
0.24g
0.2g
0%
Net carbs
6.78g
22.36g
N/A
Sugar
4.74g
0.4g
N/A
Zinc
0.24mg
0.23mg
0%
Saturated fat
0.037g
0.041g
0%
Monounsaturated fat
0.014g
0.016g
0%
Polyunsaturated fat
0.117g
0.083g
0%
Tryptophan
0.012mg
0.023mg
0%
Threonine
0.191mg
0.069mg
0%
Isoleucine
0.077mg
0.054mg
0%
Leucine
0.102mg
0.111mg
0%
Lysine
0.101mg
0.067mg
0%
Methionine
0.02mg
0.02mg
0%
Phenylalanine
0.061mg
0.082mg
0%
Valine
0.069mg
0.082mg
0%
Histidine
0.04mg
0.034mg
0%
Macronutrient Comparison
Macronutrient breakdown side-by-side comparison
2
10%
88%
Protein:
0.93 g
Fats:
0.24 g
Carbs:
9.58 g
Water:
88.29 g
Other:
0.96 g
3
26%
71%
Protein:
1.5 g
Fats:
0.2 g
Carbs:
26.46 g
Water:
70.64 g
Other:
1.2 g
Contains
more
Fats Fats
+20%
Contains
more
Water Water
+25%
Contains
more
Protein Protein
+61.3%
Contains
more
Carbs Carbs
+176.2%
Contains
more
Other Other
+25%
Fat Type Comparison
Fat type breakdown side-by-side comparison
2
22%
8%
70%
Saturated fat:
Sat. Fat
0.037 g
Monounsaturated fat:
Mono. Fat
0.014 g
Polyunsaturated fat:
Poly. Fat
0.117 g
1
29%
11%
59%
Saturated fat:
Sat. Fat
0.041 g
Monounsaturated fat:
Mono. Fat
0.016 g
Polyunsaturated fat:
Poly. Fat
0.083 g
Contains
less
Sat. Fat Saturated fat
-9.8%
Contains
more
Poly. Fat Polyunsaturated fat
+41%
Contains
more
Mono. Fat Monounsaturated fat
+14.3%