Carrot nutrition: calories, carbs, GI, protein, fiber, fats
Carrots, raw
*all the values are displayed for the amount of 100 grams
Medically reviewed by Jack Yacoubian


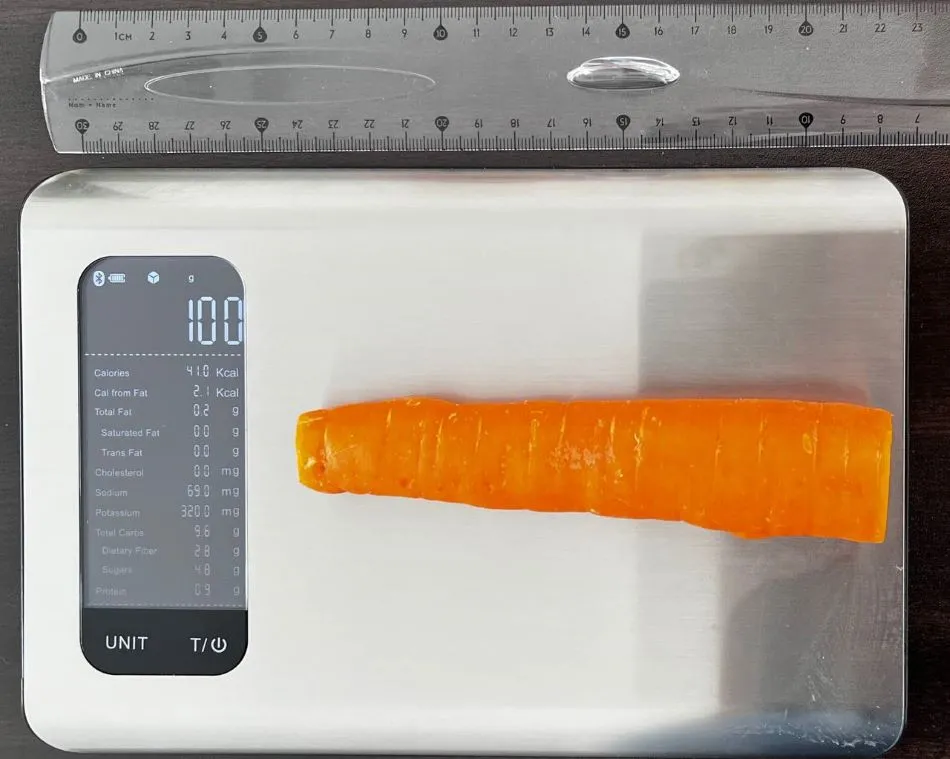
What Does 41 Calories or 100 Grams of Carrot Look Like?
We measured what 100 grams of carrot looks like to help you visualize its weight and calories.
According to our calculations, one medium-sized carrot accounted for 100 grams or 41 calories.
One serving size of carrot is about 61 grams and contains 25 calories accordingly.

Education: Nutrition & Microbiology at YSU
Last updated: November 09, 2023
Medically reviewed by Jack Yacoubian
Top nutrition facts for Carrot
| Calories ⓘ Calories for selected serving | 41 kcal |
|
Glycemic index ⓘ
Source: Check out our full article on Carrot glycemic index https://www.sciencedirect.com/science/article/pii/S000291652200494436 in this text https://www.sciencedirect.com/science/article/pii/S235261811500027X 23 here https://www.researchgate.net/publication/225096173
Check out our Glycemic index chart page for the full list.
|
39 (low) |
| Glycemic load ⓘ Glycemic Load (GL) is a metric that measures both the quality (Glycemic Index) and quantity of carbohydrates in a specific serving of food to estimate its impact on blood sugar levels. It is calculated as: (GI × Carbs in grams) / 100. | 2 (low) |
| Insulin index ⓘ The insulin index of foods demonstrates how much a food increases the insulin level in the blood, in the first two-hour period after consumption. | 42 ⓘ https://www.ncbi.nlm.nih.gov/pmc/articles/PMC3127522/ – 42 |
| Net carbs ⓘ Net Carbs = Total Carbohydrates – Fiber – Sugar Alcohols | 7 g |
| Default serving size ⓘ Serving sizes are mostly taken from FDA's Reference Amounts Customarily Consumed (RACCs) | 1 medium (61 g) |
| Acidity (Based on PRAL) ⓘ PRAL (Potential renal acid load) is calculated using a formula. On the PRAL scale the higher the positive value, the more is the acidifying effect on the body. The lower the negative value, the higher the alkalinity of the food. 0 is neutral. | -5.7 (alkaline) |
| Oxalates | 41 mg ⓘ https://www.researchgate.net/publication/280642641 |
Carrot calories (kcal)
| Calories for different serving sizes of carrot | Calories | Weight |
|---|---|---|
| Calories in 100 grams | 41 | |
| Calories in 1 slice | 1 | 3 g |
| Calories in 1 strip medium | 2 | 4 g |
| Calories in 1 medium | 25 | 61 g |
| Calories in 1 cup grated | 45 | 110 g |
| Calories in 1 cup strips or slices | 50 | 122 g |
| Calories in 1 cup chopped | 52 | 128 g |
| Calories for different varieties of carrot | Calories | Weight |
|---|---|---|
| Carrots, raw (this food) | 41 | 100 g |
| Carrots, canned, regular pack, solids and liquids | 23 | 100 g |
| Carrots, canned, no salt added, solids and liquids | 23 | 100 g |
| Carrots, canned, regular pack, drained solids | 25 | 100 g |
| Carrots, canned, no salt added, drained solids | 25 | 100 g |
| Carrots, cooked, boiled, drained, without salt | 35 | 100 g |
| Carrots, cooked, boiled, drained, with salt | 35 | 100 g |
| Carrots, baby, raw | 35 | 100 g |
| Carrots, frozen, unprepared | 36 | 100 g |
| Carrots, frozen, cooked, boiled, drained, without salt | 37 | 100 g |
| Carrots, frozen, cooked, boiled, drained, with salt | 37 | 100 g |
Extra Nutrition facts for Carrot
| Protein per 100 calories ⓘ Shows how many grams of protein you get from 100 calories of this food, calculated as (protein in g ÷ calories) × 100. | 2.3 g |
| Calories per 10 g protein ⓘ Shows how many calories you need to eat from this food to get 10 g of protein, calculated as (calories ÷ protein in g) × 10. | 441 kcal |
| Weight per 100 calories ⓘ Shows how many grams of this food equal 100 kcal—higher grams mean a larger portion for the same calories. | 244 g |
| Processing score ⓘ The processing score is a calculated value that looks at both how industrially made it is (NOVA) and how healthy/unprocessed the ingredients are (SIGA), then combines them into one score from 1 (least processed) to 4 (most processed). | 1 - Unprocessed ⓘ NOVA score = 1, SIGA score = A0 |
Carrot Glycemic index (GI)
Source:
Check out our full article on Carrot glycemic index
https://www.sciencedirect.com/science/article/pii/S000291652200494436 in this text https://www.sciencedirect.com/science/article/pii/S235261811500027X 23 here https://www.researchgate.net/publication/225096173
Check out our Glycemic index chart page for the full list.
Carrot Glycemic load (GL)
Mineral coverage chart
Mineral chart - relative view
Vitamin coverage chart
Vitamin A:
2505µg of 900µg
278%
Vitamin E:
2mg of 15mg
13%
Vitamin D:
0µg of 20µg
0%
Vitamin C:
18mg of 90mg
20%
Vitamin B1:
0.2mg of 1mg
17%
Vitamin B2:
0.17mg of 1mg
13%
Vitamin B3:
2.9mg of 16mg
18%
Vitamin B5:
0.82mg of 5mg
16%
Vitamin B6:
0.41mg of 1mg
32%
Folate:
57µg of 400µg
14%
Vitamin B12:
0µg of 2µg
0%
Vitamin K:
40µg of 120µg
33%
Vitamin chart - relative view
Macronutrients chart
Protein:
Daily Value: 2%
0.9 g of 50 g
0.9 g (2% of DV )
Fats:
Daily Value: 0%
0.2 g of 65 g
0.2 g (0% of DV )
Carbs:
Daily Value: 3%
9.6 g of 300 g
9.6 g (3% of DV )
Water:
Daily Value: 4%
88.3 g of 2,000 g
88.3 g (4% of DV )
Other:
1 g
1 g
Protein quality breakdown
Tryptophan:
36mg of 280mg
13%
Threonine:
573mg of 1,050mg
55%
Isoleucine:
231mg of 1,400mg
17%
Leucine:
306mg of 2,730mg
11%
Lysine:
303mg of 2,100mg
14%
Methionine:
60mg of 1,050mg
5.7%
Phenylalanine:
183mg of 1,750mg
10%
Valine:
207mg of 1,820mg
11%
Histidine:
120mg of 700mg
17%
Fat type information
Saturated fat:
0.04 g
Monounsaturated fat:
0.01 g
Polyunsaturated fat:
0.12 g
Carbohydrate type breakdown
Starch:
1.4 g
Sucrose:
3.6 g
Glucose:
0.59 g
Fructose:
0.55 g
Lactose:
0 g
Maltose:
0 g
Galactose:
0 g
Fiber content ratio for Carrot
Sugar:
4.7 g
Fiber:
2.8 g
Other:
2 g
All nutrients for Carrot per 100g
| Nutrient | Value | DV% | In TOP % of foods | Comparison |
| Vitamin A | 835µg | 93% | 2% | |
| Calories | 41kcal | 2% | 91% |
1.1 times less than Orange
|
| Protein | 0.93g | 2% | 86% |
3 times less than Broccoli
|
| Protein per 100 calories | 2.3g | N/A | 69% | |
| Calories per 10 g protein | 441kcal | N/A | 28% | |
| Weight per 100 calories | 244g | N/A | 10% | |
| Fats | 0.24g | 0% | 87% |
138.8 times less than Cheese
|
| Vitamin C | 5.9mg | 7% | 20% |
9 times less than Lemon
|
| Carbs | 9.6g | 3% | 50% |
2.9 times less than Rice
|
| Net carbs | 6.8g | N/A | 53% |
8 times less than Chocolate
|
| Cholesterol | 0mg | 0% | 100% |
N/A
|
| Vitamin D* | 0 IU | 0% | 100% |
N/A
|
| Vitamin D | 0µg | 0% | 100% |
N/A
|
| Magnesium | 12mg | 3% | 72% |
11.7 times less than Almonds
|
| Calcium | 33mg | 3% | 39% |
3.8 times less than Milk
|
| Potassium | 320mg | 9% | 28% |
2.2 times more than Cucumber
|
| Iron | 0.3mg | 4% | 84% |
8.7 times less than Beef broiled
|
| Sugar | 4.7g | N/A | 28% |
1.9 times less than Coca-Cola
|
| Fiber | 2.8g | 11% | 22% |
1.2 times more than Orange
|
| Copper | 0.05mg | 5% | 69% |
3.2 times less than Shiitake
|
| Zinc | 0.24mg | 2% | 75% |
26.3 times less than Beef broiled
|
| Starch | 1.4g | 1% | 10% |
10.7 times less than Potato
|
| Phosphorus | 35mg | 5% | 76% |
5.2 times less than Chicken meat
|
| Sodium | 69mg | 3% | 58% |
7.1 times less than White bread
|
| Vitamin E | 0.66mg | 4% | 20% |
2.2 times less than Kiwi
|
| Manganese | 0.14mg | 6% | 33% | |
| Selenium | 0.1µg | 0% | 77% | |
| Vitamin B1 | 0.07mg | 6% | 57% |
4 times less than Pea raw
|
| Vitamin B2 | 0.06mg | 4% | 72% |
2.2 times less than Avocado
|
| Vitamin B3 | 0.98mg | 6% | 62% |
9.7 times less than Turkey meat
|
| Vitamin B5 | 0.27mg | 5% | 51% |
4.1 times less than Sunflower seeds
|
| Vitamin B6 | 0.14mg | 11% | 47% |
1.2 times more than Oats
|
| Vitamin B12 | 0µg | 0% | 100% |
N/A
|
| Vitamin K | 13µg | 11% | 9% |
7.7 times less than Broccoli
|
| Folate | 19µg | 5% | 35% |
3.2 times less than Brussels sprouts
|
| Trans fat | 0g | N/A | 100% |
N/A
|
| Choline | 8.8mg | 2% | 41% | |
| Saturated fat | 0.04g | 0% | 84% |
159.3 times less than Beef broiled
|
| Monounsaturated fat | 0.01g | N/A | 84% |
699.9 times less than Avocado
|
| Polyunsaturated fat | 0.12g | N/A | 77% |
403.2 times less than Walnut
|
| Tryptophan | 0.01mg | 0% | 53% |
25.4 times less than Chicken meat
|
| Threonine | 0.19mg | 0% | 43% |
3.8 times less than Beef broiled
|
| Isoleucine | 0.08mg | 0% | 51% |
11.9 times less than Salmon raw
|
| Leucine | 0.1mg | 0% | 52% |
23.8 times less than Tuna Bluefin
|
| Lysine | 0.1mg | 0% | 50% |
4.5 times less than Tofu
|
| Methionine | 0.02mg | 0% | 53% |
4.8 times less than Quinoa
|
| Phenylalanine | 0.06mg | 0% | 52% |
11 times less than Egg
|
| Valine | 0.07mg | 0% | 53% |
29.4 times less than Soybean raw
|
| Histidine | 0.04mg | 0% | 51% |
18.7 times less than Turkey meat
|
| Fructose | 0.55g | 1% | 8% |
10.7 times less than Apple
|
| Caffeine | 0mg | 0% | 100% | |
| Omega-3 - EPA | 0g | N/A | 100% |
N/A
|
| Omega-3 - DHA | 0g | N/A | 100% |
N/A
|
| Omega-3 - DPA | 0g | N/A | 100% |
N/A
|
| Omega-6 - Eicosadienoic acid | 0g | N/A | 100% |
Check out similar food or compare with current
NUTRITION FACTS LABEL
Nutrition Facts
___servings per container
Serving Size ______________
Serving Size ______________
Amount Per 100g
Calories 41
% Daily Value*
0.37%
Total Fat
0.24g
0.17%
Saturated Fat 0.04g
0
Trans Fat
0g
0
Cholesterol 0mg
3%
Sodium 69mg
3.2%
Total Carbohydrate
9.6g
11%
Dietary Fiber
2.8g
Total Sugars 0g
Includes ? g Added Sugars
Protein
0.93g
Vitamin D
0mcg
0
Calcium
33mg
3.3%
Iron
0.3mg
3.8%
Potassium
320mg
9.4%
*
The % Daily Value (DV) tells you how much a nutrient in a serving of food contributes to a daily diet. 2,000 calories a day is used for general nutrition advice.
Health checks
ⓘ
Dietary cholesterol is not associated with an increased risk of coronary heart disease in healthy individuals. However, dietary cholesterol is common in foods that are high in harmful saturated fats.
Source
Low in Cholesterol
ⓘ
Trans fat consumption increases the risk of cardiovascular disease and mortality by negatively affecting blood lipid levels.
Source
No Trans Fats
ⓘ
Saturated fat intake can raise total cholesterol and LDL (low-density lipoprotein) levels, leading to an increased risk of atherosclerosis. Dietary guidelines recommend limiting saturated fats to under 10% of calories a day.
Source
Low in Saturated Fats
ⓘ
While the consumption of moderate amounts of added sugars is not detrimental to health, an excessive intake can increase the risk of obesity, and therefore, diabetes.
Source
Low in Sugars
Carrot nutrition infographic
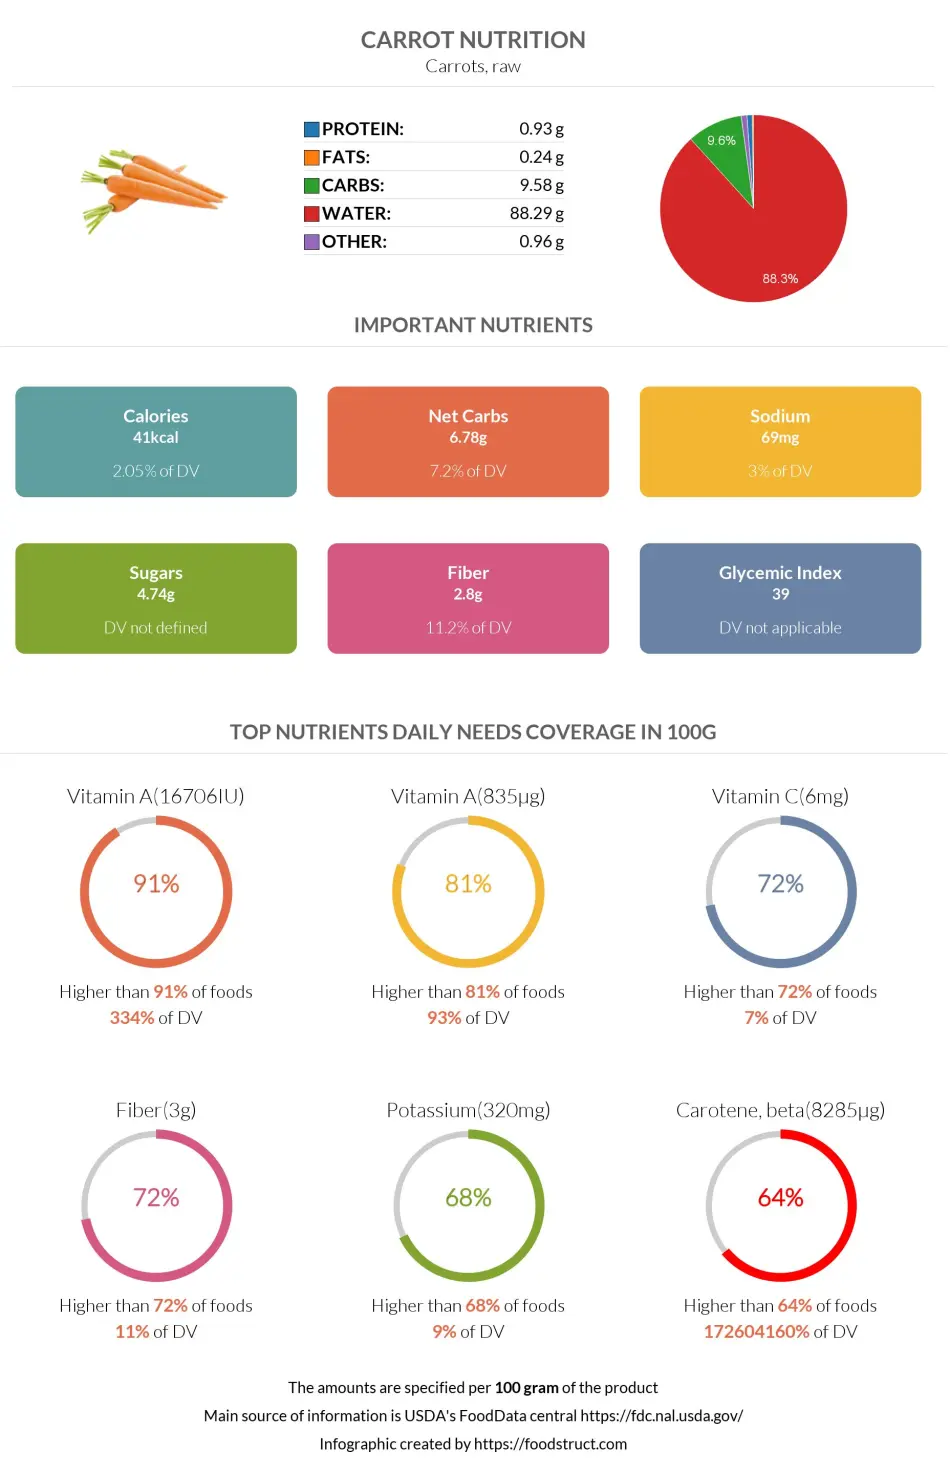
Infographic link
References
All the values for which the sources are not specified explicitly are taken from FDA’s Food Central. The exact link to the food presented on this page can be found below.