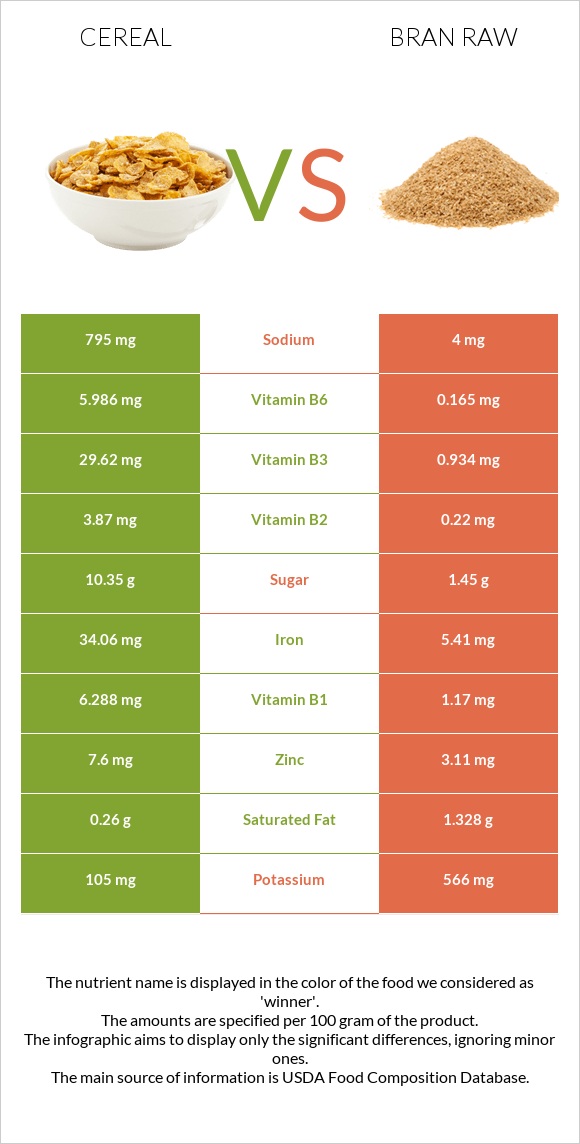
Differences between cereal and bran raw Cereal has more vitamin B6, vitamin B1, iron, vitamin B2, vitamin B3, and vitamin A, while bran raw has more manganese, phosphorus, selenium, and fiber. Cereal's daily need coverage for vitamin B6 is 448% higher. Bran raw has a lower glycemic index. The glycemic index of bran raw is 56, while the glycemic index of cereal is 69. The food types used in this comparison are Cereals ready-to-eat, USDA Commodity Corn and Rice (includes all commodity brands) and Oat bran, raw .
Infographic
Mineral Comparison
Mineral comparison score is based on the number of minerals by which one or the other food is richer. The "coverage" charts below show how much of the daily needs can be covered by 300 grams of the food.
2
100 g
300 g
1 cup - 29g 1 serving (NLEA serving = 1 cup) - 29g
Magnesium
Magnesium
Calcium
Calcium
Potassium
Potassium
Iron
Iron
Copper
Copper
Zinc
Zinc
Phosphorus
Phosphorus
Sodium
Sodium
Manganese
Manganese
Selenium
Selenium
14%
3%
9.3%
1277%
46%
207%
33%
104%
103%
34%
8
100 g
300 g
1 cup - 94g
Magnesium
Magnesium
Calcium
Calcium
Potassium
Potassium
Iron
Iron
Copper
Copper
Zinc
Zinc
Phosphorus
Phosphorus
Sodium
Sodium
Manganese
Manganese
Selenium
Selenium
168%
17%
50%
203%
134%
85%
315%
0.52%
734%
247%
Vitamin Comparison
Vitamin comparison score is based on the number of vitamins by which one or the other food is richer. The "coverage" charts below show how much of the daily needs can be covered by 300 grams of the food.
6
100 g
300 g
1 cup - 29g 1 serving (NLEA serving = 1 cup) - 29g
Vitamin C
Vit. C
Vitamin D
Vit. D
Vitamin A
Vit. A
Vitamin E
Vit. E
Vitamin B1
Vit. B1
Vitamin B2
Vit. B2
Vitamin B3
Vit. B3
Vitamin B5
Vit. B5
Vitamin B6
Vit. B6
Vitamin B12
Vit. B12
Vitamin K
Vit. K
Folate
Folate
128%
0%
271%
1.6%
1572%
893%
555%
14%
1381%
0%
0%
0%
4
100 g
300 g
1 cup - 94g
Vitamin C
Vit. C
Vitamin D
Vit. D
Vitamin A
Vit. A
Vitamin E
Vit. E
Vitamin B1
Vit. B1
Vitamin B2
Vit. B2
Vitamin B3
Vit. B3
Vitamin B5
Vit. B5
Vitamin B6
Vit. B6
Vitamin B12
Vit. B12
Vitamin K
Vit. K
Folate
Folate
0%
0%
0%
20%
293%
51%
18%
90%
38%
0%
8%
39%
All nutrients comparison - raw data values
Nutrient
DV% diff.
Vitamin B6
5.986mg
0.165mg
448%
Vitamin B1
6.288mg
1.17mg
427%
Iron
34.06mg
5.41mg
358%
Vitamin B2
3.87mg
0.22mg
281%
Manganese
0.79mg
5.63mg
210%
Vitamin B3
29.62mg
0.934mg
179%
Phosphorus
77mg
734mg
94%
Vitamin A
814µg
0µg
90%
Selenium
6.3µg
45.2µg
71%
Fiber
1.4g
15.4g
56%
Magnesium
19mg
235mg
51%
Vitamin C
38.5mg
0mg
43%
Zinc
7.6mg
3.11mg
41%
Sodium
795mg
4mg
34%
Copper
0.137mg
0.403mg
30%
Vitamin B5
0.226mg
1.494mg
25%
Protein
6.06g
17.3g
22%
Polyunsaturated fat
0.354g
2.766g
16%
Potassium
105mg
566mg
14%
Folate
52µg
13%
Fats
1.08g
7.03g
9%
Calories
378kcal
246kcal
7%
Carbs
86.85g
66.22g
7%
Vitamin E
0.08mg
1.01mg
6%
Choline
32.2mg
6%
Calcium
10mg
58mg
5%
Saturated fat
0.26g
1.328g
5%
Monounsaturated fat
0.204g
2.376g
5%
Vitamin K
0µg
3.2µg
3%
Protein per 100 calories
1.6g
7g
N/A
Calories per 10 g protein
624kcal
142kcal
N/A
Weight per 100 calories
26g
41g
N/A
Unsaturated / Saturated Fat ratio
2.1
3.9
N/A
Net carbs
85.45g
50.82g
N/A
Sugar
10.35g
1.45g
N/A
Tryptophan
0.066mg
0.335mg
0%
Threonine
0.241mg
0.502mg
0%
Isoleucine
0.26mg
0.668mg
0%
Leucine
0.767mg
1.374mg
0%
Lysine
0.113mg
0.76mg
0%
Methionine
0.13mg
0.335mg
0%
Phenylalanine
0.365mg
0.908mg
0%
Valine
0.344mg
0.964mg
0%
Histidine
0.162mg
0.41mg
0%
Fructose
0.26g
0%
Macronutrient Comparison
Macronutrient breakdown side-by-side comparison
1
6%
87%
4%
2%
Protein:
6.06 g
Fats:
1.08 g
Carbs:
86.85 g
Water:
3.78 g
Other:
2.23 g
4
17%
7%
66%
7%
3%
Protein:
17.3 g
Fats:
7.03 g
Carbs:
66.22 g
Water:
6.55 g
Other:
2.9 g
Contains
more
Carbs Carbs
+31.2%
Contains
more
Protein Protein
+185.5%
Contains
more
Fats Fats
+550.9%
Contains
more
Water Water
+73.3%
Contains
more
Other Other
+30%
Fat Type Comparison
Fat type breakdown side-by-side comparison
1
32%
25%
43%
Saturated fat:
Sat. Fat
0.26 g
Monounsaturated fat:
Mono. Fat
0.204 g
Polyunsaturated fat:
Poly. Fat
0.354 g
2
21%
37%
43%
Saturated fat:
Sat. Fat
1.328 g
Monounsaturated fat:
Mono. Fat
2.376 g
Polyunsaturated fat:
Poly. Fat
2.766 g
Contains
less
Sat. Fat Saturated fat
-80.4%
Contains
more
Mono. Fat Monounsaturated fat
+1064.7%
Contains
more
Poly. Fat Polyunsaturated fat
+681.4%