Summary of differences between cereal and rice Rice has less vitamin B1, vitamin B6, iron, vitamin B2, vitamin B3, zinc, vitamin A, vitamin C, and manganese than cereal. Cereal covers your daily need for vitamin B1, 522% more than rice. Rice has less sodium. These are the specific foods used in this comparison Cereals ready-to-eat, USDA Commodity Corn and Rice (includes all commodity brands) and Rice, white, long-grain, regular, unenriched, cooked without salt .
Infographic
Mineral Comparison
Mineral comparison score is based on the number of minerals by which one or the other food is richer. The "coverage" charts below show how much of the daily needs can be covered by 300 grams of the food.
7
100 g
300 g
1 cup - 29g 1 serving (NLEA serving = 1 cup) - 29g
Magnesium
Magnesium
Calcium
Calcium
Potassium
Potassium
Iron
Iron
Copper
Copper
Zinc
Zinc
Phosphorus
Phosphorus
Sodium
Sodium
Manganese
Manganese
Selenium
Selenium
14%
3%
9.3%
1277%
46%
207%
33%
104%
103%
34%
2
100 g
300 g
1 cup - 158g
Magnesium
Magnesium
Calcium
Calcium
Potassium
Potassium
Iron
Iron
Copper
Copper
Zinc
Zinc
Phosphorus
Phosphorus
Sodium
Sodium
Manganese
Manganese
Selenium
Selenium
8.6%
3%
3.1%
7.5%
23%
13%
18%
0.13%
62%
41%
Vitamin Comparison
Vitamin comparison score is based on the number of vitamins by which one or the other food is richer. The "coverage" charts below show how much of the daily needs can be covered by 300 grams of the food.
7
100 g
300 g
1 cup - 29g 1 serving (NLEA serving = 1 cup) - 29g
Vitamin C
Vit. C
Vitamin D
Vit. D
Vitamin A
Vit. A
Vitamin E
Vit. E
Vitamin B1
Vit. B1
Vitamin B2
Vit. B2
Vitamin B3
Vit. B3
Vitamin B5
Vit. B5
Vitamin B6
Vit. B6
Vitamin B12
Vit. B12
Vitamin K
Vit. K
Folate
Folate
128%
0%
271%
1.6%
1572%
893%
555%
14%
1381%
0%
0%
0%
2
100 g
300 g
1 cup - 158g
Vitamin C
Vit. C
Vitamin D
Vit. D
Vitamin A
Vit. A
Vitamin E
Vit. E
Vitamin B1
Vit. B1
Vitamin B2
Vit. B2
Vitamin B3
Vit. B3
Vitamin B5
Vit. B5
Vitamin B6
Vit. B6
Vitamin B12
Vit. B12
Vitamin K
Vit. K
Folate
Folate
0%
0%
0%
0.8%
5%
3%
7.5%
23%
21%
0%
0%
2.3%
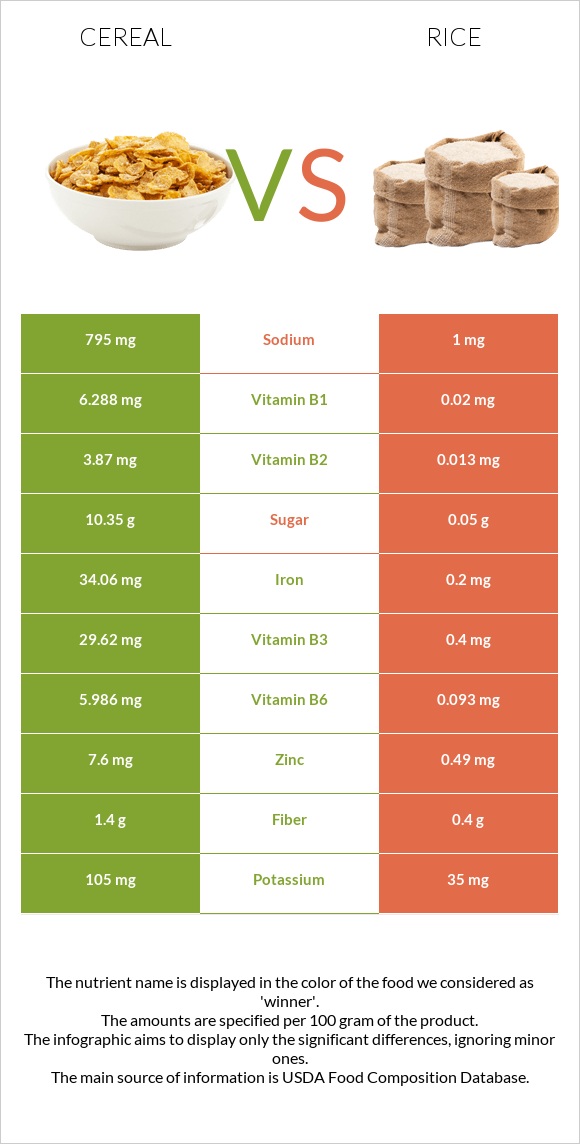
All nutrients comparison - raw data values
Nutrient
DV% diff.
Vitamin B1
6.288mg
0.02mg
522%
Vitamin B6
5.986mg
0.093mg
453%
Iron
34.06mg
0.2mg
423%
Vitamin B2
3.87mg
0.013mg
297%
Vitamin B3
29.62mg
0.4mg
183%
Vitamin A
814µg
0µg
90%
Zinc
7.6mg
0.49mg
65%
Vitamin C
38.5mg
0mg
43%
Sodium
795mg
1mg
35%
Carbs
86.85g
28.17g
20%
Manganese
0.79mg
0.472mg
14%
Calories
378kcal
130kcal
12%
Copper
0.137mg
0.069mg
8%
Protein
6.06g
2.69g
7%
Phosphorus
77mg
43mg
5%
Fiber
1.4g
0.4g
4%
Vitamin B5
0.226mg
0.39mg
3%
Magnesium
19mg
12mg
2%
Potassium
105mg
35mg
2%
Selenium
6.3µg
7.5µg
2%
Polyunsaturated fat
0.354g
0.076g
2%
Fats
1.08g
0.28g
1%
Folate
3µg
1%
Saturated fat
0.26g
0.077g
1%
Protein per 100 calories
1.6g
2.1g
N/A
Calories per 10 g protein
624kcal
483kcal
N/A
Weight per 100 calories
26g
77g
N/A
Net carbs
85.45g
27.77g
N/A
Calcium
10mg
10mg
0%
Sugar
10.35g
0.05g
N/A
Vitamin E
0.08mg
0.04mg
0%
Choline
2.1mg
0%
Monounsaturated fat
0.204g
0.088g
0%
Tryptophan
0.066mg
0.031mg
0%
Threonine
0.241mg
0.096mg
0%
Isoleucine
0.26mg
0.116mg
0%
Leucine
0.767mg
0.222mg
0%
Lysine
0.113mg
0.097mg
0%
Methionine
0.13mg
0.063mg
0%
Phenylalanine
0.365mg
0.144mg
0%
Valine
0.344mg
0.164mg
0%
Histidine
0.162mg
0.063mg
0%
Fructose
0.26g
0%
Macronutrient Comparison
Macronutrient breakdown side-by-side comparison
4
6%
87%
4%
2%
Protein:
6.06 g
Fats:
1.08 g
Carbs:
86.85 g
Water:
3.78 g
Other:
2.23 g
1
3%
28%
68%
Protein:
2.69 g
Fats:
0.28 g
Carbs:
28.17 g
Water:
68.44 g
Other:
0.42 g
Contains
more
Protein Protein
+125.3%
Contains
more
Fats Fats
+285.7%
Contains
more
Carbs Carbs
+208.3%
Contains
more
Other Other
+431%
Contains
more
Water Water
+1710.6%
Fat Type Comparison
Fat type breakdown side-by-side comparison
2
32%
25%
43%
Saturated fat:
Sat. Fat
0.26 g
Monounsaturated fat:
Mono. Fat
0.204 g
Polyunsaturated fat:
Poly. Fat
0.354 g
1
32%
37%
32%
Saturated fat:
Sat. Fat
0.077 g
Monounsaturated fat:
Mono. Fat
0.088 g
Polyunsaturated fat:
Poly. Fat
0.076 g
Contains
more
Mono. Fat Monounsaturated fat
+131.8%
Contains
more
Poly. Fat Polyunsaturated fat
+365.8%
Contains
less
Sat. Fat Saturated fat
-70.4%