Summary of differences between cheese and barley Cheese has more calcium and vitamin B12; however, barley is higher in manganese, fiber, copper, vitamin B1, iron, and vitamin B3. Cheese covers your daily need for saturated fat, 92% more than barley. Barley has less cholesterol. The glycemic index of barley is higher. These are the specific foods used in this comparison Cheese, cheddar and Barley, hulled .
Infographic
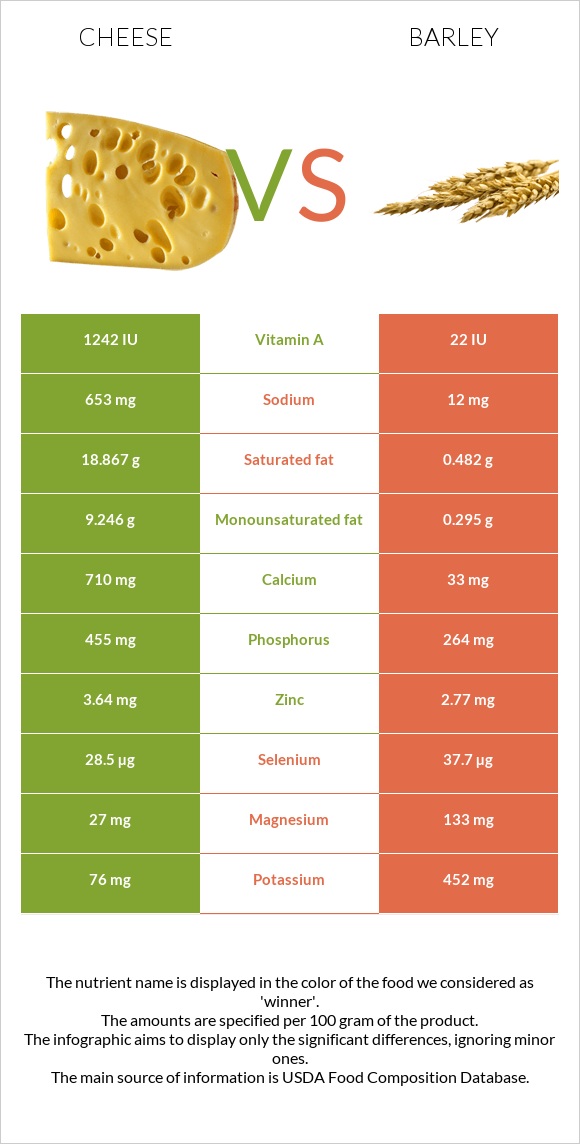
Mineral Comparison
Mineral comparison score is based on the number of minerals by which one or the other food is richer. The "coverage" charts below show how much of the daily needs can be covered by 300 grams of the food.
3
100 g
300 g
1 cubic inch - 17g 1 slice (1 oz) - 28g 1 oz - 28.35g 1 cup, shredded - 113g 1 cup, diced - 132g 1 cup, melted - 244g
Magnesium
Magnesium
Calcium
Calcium
Potassium
Potassium
Iron
Iron
Copper
Copper
Zinc
Zinc
Phosphorus
Phosphorus
Sodium
Sodium
Manganese
Manganese
Selenium
Selenium
19%
213%
6.7%
5.3%
10%
99%
195%
85%
3.5%
155%
7
100 g
300 g
1 cup - 184g
Magnesium
Magnesium
Calcium
Calcium
Potassium
Potassium
Iron
Iron
Copper
Copper
Zinc
Zinc
Phosphorus
Phosphorus
Sodium
Sodium
Manganese
Manganese
Selenium
Selenium
95%
9.9%
40%
135%
166%
76%
113%
1.6%
253%
206%
Vitamin Comparison
Vitamin comparison score is based on the number of vitamins by which one or the other food is richer. The "coverage" charts below show how much of the daily needs can be covered by 300 grams of the food.
7
100 g
300 g
1 cubic inch - 17g 1 slice (1 oz) - 28g 1 oz - 28.35g 1 cup, shredded - 113g 1 cup, diced - 132g 1 cup, melted - 244g
Vitamin C
Vit. C
Vitamin D
Vit. D
Vitamin A
Vit. A
Vitamin E
Vit. E
Vitamin B1
Vit. B1
Vitamin B2
Vit. B2
Vitamin B3
Vit. B3
Vitamin B5
Vit. B5
Vitamin B6
Vit. B6
Vitamin B12
Vit. B12
Vitamin K
Vit. K
Folate
Folate
0%
9%
110%
14%
7.3%
99%
1.1%
25%
15%
138%
6%
20%
3
100 g
300 g
1 cup - 184g
Vitamin C
Vit. C
Vitamin D
Vit. D
Vitamin A
Vit. A
Vitamin E
Vit. E
Vitamin B1
Vit. B1
Vitamin B2
Vit. B2
Vitamin B3
Vit. B3
Vitamin B5
Vit. B5
Vitamin B6
Vit. B6
Vitamin B12
Vit. B12
Vitamin K
Vit. K
Folate
Folate
0%
0%
0.33%
11%
162%
66%
86%
17%
73%
0%
5.5%
14%
All nutrients comparison - raw data values
Nutrient
DV% diff.
Saturated fat
18.867g
0.482g
84%
Manganese
0.027mg
1.943mg
83%
Fiber
0g
17.3g
69%
Calcium
710mg
33mg
68%
Copper
0.03mg
0.498mg
52%
Vitamin B1
0.029mg
0.646mg
51%
Fats
33.31g
2.3g
48%
Vitamin B12
1.1µg
0µg
46%
Iron
0.14mg
3.6mg
43%
Vitamin A
330µg
1µg
37%
Cholesterol
99mg
0mg
33%
Sodium
653mg
12mg
28%
Vitamin B3
0.059mg
4.604mg
28%
Phosphorus
455mg
264mg
27%
Magnesium
27mg
133mg
25%
Carbs
3.09g
73.48g
23%
Monounsaturated fat
9.246g
0.295g
22%
Protein
22.87g
12.48g
21%
Vitamin B6
0.066mg
0.318mg
19%
Selenium
28.5µg
37.7µg
17%
Potassium
76mg
452mg
11%
Vitamin B2
0.428mg
0.285mg
11%
Zinc
3.64mg
2.77mg
8%
Calories
404kcal
354kcal
3%
Vitamin D*
24 IU
0 IU
3%
Vitamin D
0.6µg
0µg
3%
Vitamin B5
0.41mg
0.282mg
3%
Choline
16.5mg
3%
Folate
27µg
19µg
2%
Polyunsaturated fat
1.421g
1.108g
2%
Vitamin E
0.71mg
0.57mg
1%
Protein per 100 calories
5.7g
3.5g
N/A
Calories per 10 g protein
177kcal
284kcal
N/A
Weight per 100 calories
25g
28g
N/A
Unsaturated / Saturated Fat ratio
0.57
2.9
N/A
Net carbs
3.09g
56.18g
N/A
Sugar
0.48g
0.8g
N/A
Vitamin K
2.4µg
2.2µg
0%
Trans fat
0.917g
N/A
Tryptophan
0.547mg
0.208mg
0%
Threonine
1.044mg
0.424mg
0%
Isoleucine
1.206mg
0.456mg
0%
Leucine
1.939mg
0.848mg
0%
Lysine
1.025mg
0.465mg
0%
Methionine
0.547mg
0.24mg
0%
Phenylalanine
1.074mg
0.7mg
0%
Valine
1.404mg
0.612mg
0%
Histidine
0.547mg
0.281mg
0%
Omega-3 - EPA
0.01g
0g
N/A
Omega-3 - DHA
0.001g
0g
N/A
Omega-3 - DPA
0.017g
0g
N/A
Omega-6 - Eicosadienoic acid
0.007g
N/A
Macronutrient Comparison
Macronutrient breakdown side-by-side comparison
4
23%
33%
3%
37%
4%
Protein:
22.87 g
Fats:
33.31 g
Carbs:
3.09 g
Water:
37.02 g
Other:
3.71 g
1
12%
2%
73%
9%
2%
Protein:
12.48 g
Fats:
2.3 g
Carbs:
73.48 g
Water:
9.44 g
Other:
2.3 g
Contains
more
Protein Protein
+83.3%
Contains
more
Fats Fats
+1348.3%
Contains
more
Water Water
+292.2%
Contains
more
Other Other
+61.3%
Contains
more
Carbs Carbs
+2278%
Fat Type Comparison
Fat type breakdown side-by-side comparison
2
64%
31%
5%
Saturated fat:
Sat. Fat
18.867 g
Monounsaturated fat:
Mono. Fat
9.246 g
Polyunsaturated fat:
Poly. Fat
1.421 g
1
26%
16%
59%
Saturated fat:
Sat. Fat
0.482 g
Monounsaturated fat:
Mono. Fat
0.295 g
Polyunsaturated fat:
Poly. Fat
1.108 g
Contains
more
Mono. Fat Monounsaturated fat
+3034.2%
Contains
more
Poly. Fat Polyunsaturated fat
+28.2%
Contains
less
Sat. Fat Saturated fat
-97.4%