Cheddar Cheese vs Feta Cheese - Health impact and Nutrition Comparison


Summary
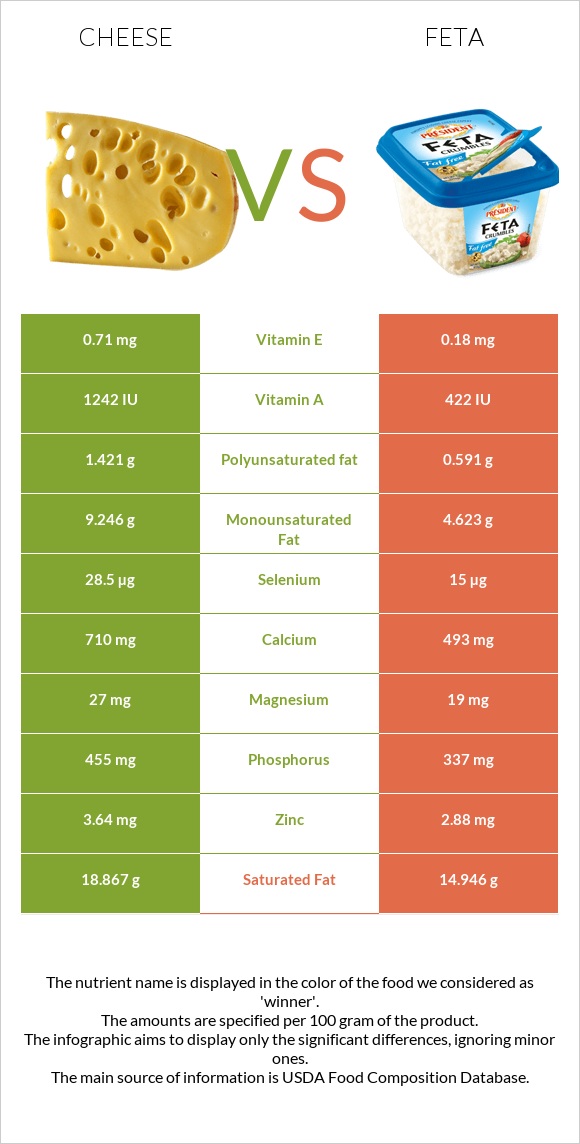
Considering the nutritional difference, cheddar cheese is higher in calories, total fats, and saturated fats. It has a lower glycemic index and is richer in proteins, zinc, phosphorus, calcium, and vitamin A. Feta cheese is richer in B complex vitamins and contains higher sodium.
When it comes to health, they are similarly healthy cheeses to eat. However, when it comes to cardiovascular health, there is an increase in the risks of hypertension and atherosclerosis. Higher risks of hypertension in feta. Higher risks of atherosclerosis in cheddar. Both should be eaten in moderation.
Introduction
In this article, we will compare feta cheese to cheddar cheese. They are both kinds of cheese; however, a difference exists between them. We will discuss their general difference, their nutritional differences, and their health impacts.
At the end of this article, we will understand from these two kinds of cheese which one is healthier and the differences between them.
General differences
In short, feta and cheddar are cheese, but different aspects exist between them.
The first difference is that cheddar cheese is an aged cheese that, to make it flavored, solid, and matured, usually requires 15 months. In contrast, feta is a fresh cheese.
This brings us to the shelf life of each cheese. Cheddar cheese has a longer shelf life before cutting the cheese wheel, which, as we mentioned above, requires 15 months. In contrast, feta cheese has a shorter shelf life which, when opened and refrigerated, turns bad after about seven days.
It is also important to mention that cheddar cheese is prepared with cow milk. In contrast, feta is mainly prepared with sheep and goat's milk. However, nowadays, feta available in the market can be from cow's milk.
Nutrional content comparison
Calories
Cheddar contains 1.5 times more calories than feta.
Cheddar contains nearly 400 calories per 100g.
Glycemic index
Feta has a higher glycemic index compared to cheddar. The glycemic index of feta is categorized as low.
Carbs
They have nearly similar amounts of carbs, and they are classified as low carbs.
Proteins
Cheddar is richer in proteins than feta.
Fats
Cheddar contains higher amounts of fats. The difference is 1.5 times higher. This section will discuss the types of fats present in both kinds of cheese.
Saturated fats
They are both high in saturated fats. However, cheddar cheese contains higher amounts of saturated fats.
Cholesterol
The cholesterol content in both foods is nearly similar.
Minerals
Cheddar is richer in all minerals compared to feta. It is richer in zinc, phosphorus, and calcium.
It is essential to highlight that feta is rich in these minerals. However, relatively cheddar contains higher amounts.
Sodium
Both cheddar and feta are high in sodium. Feta cheese contains higher amounts of sodium.
Below is the diagram that displays the distribution of the minerals.
Mineral Comparison
Contains
more
MagnesiumMagnesium
+42.1%
Contains
more
CalciumCalcium
+44%
Contains
more
PotassiumPotassium
+22.6%
Contains
more
ZincZinc
+26.4%
Contains
more
PhosphorusPhosphorus
+35%
Contains
less
SodiumSodium
-28.8%
Contains
more
SeleniumSelenium
+90%
Contains
more
IronIron
+364.3%
Vitamins
Feta cheese is richer in B complex vitamins, whereas cheddar is richer in vitamin A.
Below is the diagram that displays the distribution of the vitamins.
Vitamin Comparison
Contains
more
Vitamin DVitamin D
+50%
Contains
more
Vitamin AVitamin A
+164%
Contains
more
Vitamin EVitamin E
+294.4%
Contains
more
Vitamin KVitamin K
+33.3%
Contains
more
Vitamin B1Vitamin B1
+431%
Contains
more
Vitamin B2Vitamin B2
+97.2%
Contains
more
Vitamin B3Vitamin B3
+1579.7%
Contains
more
Vitamin B5Vitamin B5
+135.9%
Contains
more
Vitamin B6Vitamin B6
+542.4%
Contains
more
Vitamin B12Vitamin B12
+53.6%
Contains
more
FolateFolate
+18.5%
Health impacts
Bone health
Cheddar and feta cheese are rich in calcium and positively impact bones, especially osteoporosis. (1) (2)
Gastrointestinal health
They contain lactobacilli and other probiotics that may promote overall gut health and improve digestion. (3)
In addition, when the gut microbiome is healthy, overall inflammation in the gastrointestinal system is maintained at reduced levels. (4) (5)
Both feta and cheddar cheeses contain lactose which can cause bloating, nausea, and diarrhea in lactose-intolerant individuals.
Cancer
Cheddar cheese and feta reduce the risks of developing colorectal cancer. (6)
Whereas when it comes to prostate cancer, there is an increased risk of developing prostate cancer associated with calcium-rich foods. (7)
Cardiovascular health
When comparing cheddar cheese and feta cheese in terms of cardiovascular disease (CVD) risk, several factors come into play:
Saturated Fat Content: Cheddar cheese typically contains higher levels of saturated fat compared to feta cheese. A high intake of saturated fat is associated with an increased cardiovascular risk as it can raise levels of LDL cholesterol, often referred to as "bad" cholesterol (8).
Salt Content: Feta cheese tends to be higher in sodium compared to cheddar cheese. Excessive sodium intake can contribute to hypertension, a risk factor for CVD (9).
Cheddar cheese and feta, along with other aged or fermented foods, contain high levels of tyramine. Tyramine is a substance that can cause a dangerous rise in blood pressure when combined with MAO inhibitor drugs (a class of medications used primarily to treat depression and anxiety disorders). Consuming these foods while taking MAO inhibitors can potentially lead to a hypertensive crisis, which is a severe and potentially life-threatening increase in blood pressure (10).
In general, moderation is key when consuming cheese as part of a heart-healthy diet. Choosing lower-fat options, such as reduced-fat cheddar or lower-sodium feta, can help mitigate some of the potential risks associated with cheese consumption. Additionally, incorporating a variety of foods, including fruits, vegetables, whole grains, and lean proteins, is important for overall cardiovascular health.
Diabetes
There are decreased risks of developing type 2 diabetes with cheddar cheese and feta intake. (11) (12)
References
- https://pubmed.ncbi.nlm.nih.gov/33237064/
- https://www.ncbi.nlm.nih.gov/pmc/articles/PMC3796667/
- https://www.ncbi.nlm.nih.gov/pmc/articles/PMC3279064/
- https://pubmed.ncbi.nlm.nih.gov/20838859/
- https://pubmed.ncbi.nlm.nih.gov/21477383/
- https://pubmed.ncbi.nlm.nih.gov/12869397/
- https://pubmed.ncbi.nlm.nih.gov/16522915/
- https://www.nature.com/articles/s41598-021-86324-w
- https://pubmed.ncbi.nlm.nih.gov/30402970/
- https://www.ncbi.nlm.nih.gov/pmc/articles/PMC2738414/
- https://pubmed.ncbi.nlm.nih.gov/23945722/
- https://www.sciencedirect.com/science/article/abs/pii/S0002822304004316

Infographic
All nutrients comparison - raw data values
| Nutrient | |
|
DV% diff. |
| Vitamin B2 | 0.428mg | 0.844mg | 32% |
| Vitamin B6 | 0.066mg | 0.424mg | 28% |
| Selenium | 28.5µg | 15µg | 25% |
| Vitamin B12 | 1.1µg | 1.69µg | 25% |
| Vitamin A | 330µg | 125µg | 23% |
| Calcium | 710mg | 493mg | 22% |
| Fats | 33.31g | 21.28g | 19% |
| Saturated fat | 18.867g | 14.946g | 18% |
| Protein | 22.87g | 14.21g | 17% |
| Phosphorus | 455mg | 337mg | 17% |
| Monounsaturated fat | 9.246g | 4.623g | 12% |
| Sodium | 653mg | 917mg | 11% |
| Vitamin B5 | 0.41mg | 0.967mg | 11% |
| Vitamin B1 | 0.029mg | 0.154mg | 10% |
| Calories | 404kcal | 264kcal | 7% |
| Zinc | 3.64mg | 2.88mg | 7% |
| Iron | 0.14mg | 0.65mg | 6% |
| Vitamin B3 | 0.059mg | 0.991mg | 6% |
| Polyunsaturated fat | 1.421g | 0.591g | 6% |
| Vitamin E | 0.71mg | 0.18mg | 4% |
| Cholesterol | 99mg | 89mg | 3% |
| Magnesium | 27mg | 19mg | 2% |
| Vitamin D* | 24 IU | 16 IU | 1% |
| Vitamin D | 0.6µg | 0.4µg | 1% |
| Vitamin K | 2.4µg | 1.8µg | 1% |
| Folate | 27µg | 32µg | 1% |
| Protein per 100 calories | 5.7g | 5.4g | N/A |
| Calories per 10 g protein | 177kcal | 186kcal | N/A |
| Weight per 100 calories | 25g | 38g | N/A |
| Unsaturated / Saturated Fat ratio | 0.57 | 0.35 | N/A |
| Net carbs | 3.09g | 4.09g | N/A |
| Carbs | 3.09g | 4.09g | 0% |
| Potassium | 76mg | 62mg | 0% |
| Sugar | 0.48g | 4.09g | N/A |
| Copper | 0.03mg | 0.032mg | 0% |
| Manganese | 0.027mg | 0.028mg | 0% |
| Trans fat | 0.917g | N/A | |
| Choline | 16.5mg | 15.4mg | 0% |
| Tryptophan | 0.547mg | 0.2mg | 0% |
| Threonine | 1.044mg | 0.637mg | 0% |
| Isoleucine | 1.206mg | 0.803mg | 0% |
| Leucine | 1.939mg | 1.395mg | 0% |
| Lysine | 1.025mg | 1.219mg | 0% |
| Methionine | 0.547mg | 0.368mg | 0% |
| Phenylalanine | 1.074mg | 0.675mg | 0% |
| Valine | 1.404mg | 1.065mg | 0% |
| Histidine | 0.547mg | 0.397mg | 0% |
| Omega-3 - EPA | 0.01g | 0g | N/A |
| Omega-3 - DHA | 0.001g | 0g | N/A |
| Omega-3 - DPA | 0.017g | 0g | N/A |
| Omega-6 - Eicosadienoic acid | 0.007g | N/A |
Macronutrient Comparison
| Contains more ProteinProtein | +60.9% |
| Contains more FatsFats | +56.5% |
| Contains more CarbsCarbs | +32.4% |
| Contains more WaterWater | +49.2% |
| Contains more OtherOther | +40.2% |
Fat Type Comparison
| Contains more Mono. FatMonounsaturated fat | +100% |
| Contains more Poly. FatPolyunsaturated fat | +140.4% |
| Contains less Sat. FatSaturated fat | -20.8% |
People also compare


References
All the values for which the sources are not specified explicitly are taken from FDA’s Food Central. The exact link to the food presented on this page can be found below.
- Cheese - https://fdc.nal.usda.gov/fdc-app.html#/food-details/173414/nutrients
- Feta - https://fdc.nal.usda.gov/fdc-app.html#/food-details/173420/nutrients
All the Daily Values are presented for males aged 31-50, for 2000-calorie diets.