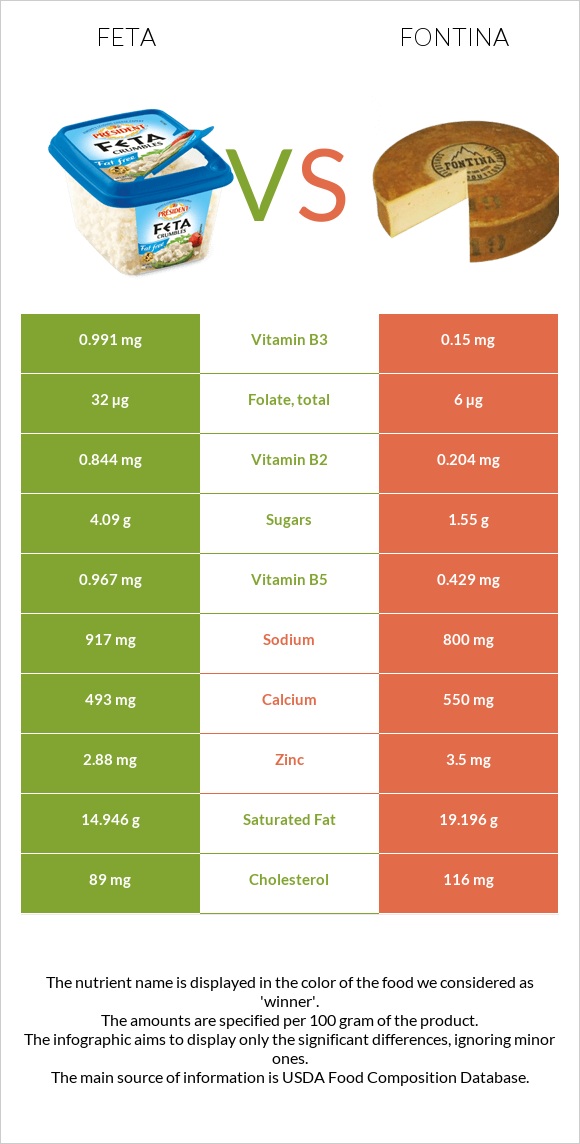
How are feta and fontina different? Feta is higher in vitamin B2, vitamin B6, vitamin B1, vitamin B5, and folate; however, fontina is richer in vitamin A, calcium, and zinc. Daily need coverage for vitamin B2 for feta is 49% higher. Feta contains 7 times more vitamin B1 than fontina. While feta contains 0.154mg of vitamin B1, fontina contains only 0.021mg. Feta has less saturated fat. Cheese, feta and Cheese, fontina are the varieties used in this article.
Infographic
Mineral Comparison
Mineral comparison score is based on the number of minerals by which one or the other food is richer. The "coverage" charts below show how much of the daily needs can be covered by 300 grams of the food.
4
100 g
300 g
1 cubic inch - 17g 1 oz - 28.35g 1 wedge (1.33 oz) - 38g 1 cup, crumbled - 150g
Magnesium
Magnesium
Calcium
Calcium
Potassium
Potassium
Iron
Iron
Copper
Copper
Zinc
Zinc
Phosphorus
Phosphorus
Sodium
Sodium
Manganese
Manganese
Selenium
Selenium
14%
148%
5.5%
24%
11%
79%
144%
120%
3.7%
82%
3
100 g
300 g
1 cubic inch - 15g 1 slice (1 oz) - 28g 1 oz - 28.35g 1 cup, shredded - 108g 1 cup, diced - 132g 1 package (8 oz) - 227g
Magnesium
Magnesium
Calcium
Calcium
Potassium
Potassium
Iron
Iron
Copper
Copper
Zinc
Zinc
Phosphorus
Phosphorus
Sodium
Sodium
Manganese
Manganese
Selenium
Selenium
10%
165%
5.6%
8.6%
8.3%
95%
148%
104%
1.8%
79%
Vitamin Comparison
Vitamin comparison score is based on the number of vitamins by which one or the other food is richer. The "coverage" charts below show how much of the daily needs can be covered by 300 grams of the food.
6
100 g
300 g
1 cubic inch - 17g 1 oz - 28.35g 1 wedge (1.33 oz) - 38g 1 cup, crumbled - 150g
Vitamin C
Vit. C
Vitamin D
Vit. D
Vitamin A
Vit. A
Vitamin E
Vit. E
Vitamin B1
Vit. B1
Vitamin B2
Vit. B2
Vitamin B3
Vit. B3
Vitamin B5
Vit. B5
Vitamin B6
Vit. B6
Vitamin B12
Vit. B12
Vitamin K
Vit. K
Folate
Folate
0%
6%
42%
3.6%
39%
195%
19%
58%
98%
211%
4.5%
24%
4
100 g
300 g
1 cubic inch - 15g 1 slice (1 oz) - 28g 1 oz - 28.35g 1 cup, shredded - 108g 1 cup, diced - 132g 1 package (8 oz) - 227g
Vitamin C
Vit. C
Vitamin D
Vit. D
Vitamin A
Vit. A
Vitamin E
Vit. E
Vitamin B1
Vit. B1
Vitamin B2
Vit. B2
Vitamin B3
Vit. B3
Vitamin B5
Vit. B5
Vitamin B6
Vit. B6
Vitamin B12
Vit. B12
Vitamin K
Vit. K
Folate
Folate
0%
9%
87%
5.4%
5.3%
47%
2.8%
26%
19%
210%
6.5%
4.5%
All nutrients comparison - raw data values
Nutrient
DV% diff.
Vitamin B2
0.844mg
0.204mg
49%
Vitamin B6
0.424mg
0.083mg
26%
Protein
14.21g
25.6g
23%
Saturated fat
14.946g
19.196g
19%
Fats
21.28g
31.14g
15%
Vitamin A
125µg
261µg
15%
Vitamin B1
0.154mg
0.021mg
11%
Vitamin B5
0.967mg
0.429mg
11%
Monounsaturated fat
4.623g
8.687g
10%
Cholesterol
89mg
116mg
9%
Folate
32µg
6µg
7%
Polyunsaturated fat
0.591g
1.654g
7%
Calories
264kcal
389kcal
6%
Calcium
493mg
550mg
6%
Zinc
2.88mg
3.5mg
6%
Iron
0.65mg
0.23mg
5%
Sodium
917mg
800mg
5%
Vitamin B3
0.991mg
0.15mg
5%
Carbs
4.09g
1.55g
1%
Vitamin D*
16 IU
23 IU
1%
Vitamin D
0.4µg
0.6µg
1%
Magnesium
19mg
14mg
1%
Copper
0.032mg
0.025mg
1%
Phosphorus
337mg
346mg
1%
Vitamin E
0.18mg
0.27mg
1%
Manganese
0.028mg
0.014mg
1%
Selenium
15µg
14.5µg
1%
Vitamin K
1.8µg
2.6µg
1%
Protein per 100 calories
5.4g
6.6g
N/A
Calories per 10 g protein
186kcal
152kcal
N/A
Weight per 100 calories
38g
26g
N/A
Unsaturated / Saturated Fat ratio
0.35
0.54
N/A
Net carbs
4.09g
1.55g
N/A
Potassium
62mg
64mg
0%
Sugar
4.09g
1.55g
N/A
Vitamin B12
1.69µg
1.68µg
0%
Choline
15.4mg
15.4mg
0%
Tryptophan
0.2mg
0.361mg
0%
Threonine
0.637mg
0.935mg
0%
Isoleucine
0.803mg
1.384mg
0%
Leucine
1.395mg
2.664mg
0%
Lysine
1.219mg
2.328mg
0%
Methionine
0.368mg
0.706mg
0%
Phenylalanine
0.675mg
1.497mg
0%
Valine
1.065mg
1.926mg
0%
Histidine
0.397mg
0.959mg
0%
Macronutrient Comparison
Macronutrient breakdown side-by-side comparison
3
14%
21%
4%
55%
5%
Protein:
14.21 g
Fats:
21.28 g
Carbs:
4.09 g
Water:
55.22 g
Other:
5.2 g
2
26%
31%
38%
4%
Protein:
25.6 g
Fats:
31.14 g
Carbs:
1.55 g
Water:
37.92 g
Other:
3.79 g
Contains
more
Carbs Carbs
+163.9%
Contains
more
Water Water
+45.6%
Contains
more
Other Other
+37.2%
Contains
more
Protein Protein
+80.2%
Contains
more
Fats Fats
+46.3%
Fat Type Comparison
Fat type breakdown side-by-side comparison
1
74%
23%
3%
Saturated fat:
Sat. Fat
14.946 g
Monounsaturated fat:
Mono. Fat
4.623 g
Polyunsaturated fat:
Poly. Fat
0.591 g
2
65%
29%
6%
Saturated fat:
Sat. Fat
19.196 g
Monounsaturated fat:
Mono. Fat
8.687 g
Polyunsaturated fat:
Poly. Fat
1.654 g
Contains
less
Sat. Fat Saturated fat
-22.1%
Contains
more
Mono. Fat Monounsaturated fat
+87.9%
Contains
more
Poly. Fat Polyunsaturated fat
+179.9%