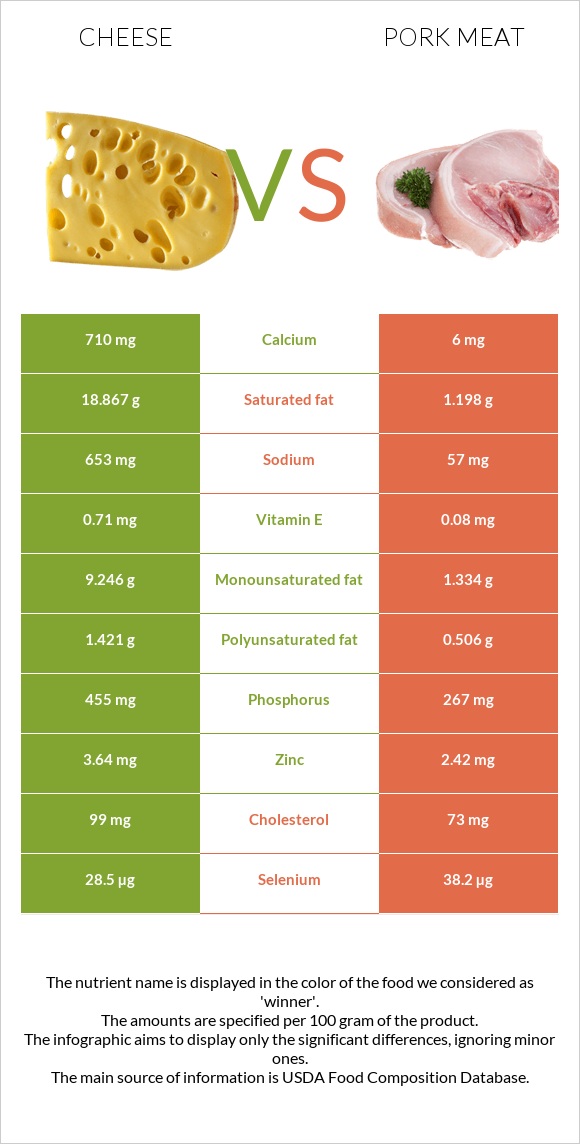
Significant differences between cheese and pork Meat Cheese has more calcium, phosphorus, vitamin A, and vitamin B12; however, pork Meat is richer in vitamin B1, vitamin B6, vitamin B3, and selenium. Cheese covers your daily saturated fat needs 88% more than pork Meat. Pork Meat contains less saturated fat. Specific food types used in this comparison are Cheese, cheddar and Pork, fresh, loin, tenderloin, separable lean only, cooked, roasted .
Infographic
Mineral Comparison
Mineral comparison score is based on the number of minerals by which one or the other food is richer. The "coverage" charts below show how much of the daily needs can be covered by 300 grams of the food.
4
100 g
300 g
1 cubic inch - 17g 1 slice (1 oz) - 28g 1 oz - 28.35g 1 cup, shredded - 113g 1 cup, diced - 132g 1 cup, melted - 244g
Magnesium
Magnesium
Calcium
Calcium
Potassium
Potassium
Iron
Iron
Copper
Copper
Zinc
Zinc
Phosphorus
Phosphorus
Sodium
Sodium
Manganese
Manganese
Selenium
Selenium
19%
213%
6.7%
5.3%
10%
99%
195%
85%
3.5%
155%
5
100 g
300 g
3 oz - 85g 1 piece, cooked, excluding refuse (yield from 1 lb raw meat with refuse) - 333g 1 roast - 402g
Magnesium
Magnesium
Calcium
Calcium
Potassium
Potassium
Iron
Iron
Copper
Copper
Zinc
Zinc
Phosphorus
Phosphorus
Sodium
Sodium
Manganese
Manganese
Selenium
Selenium
21%
1.8%
37%
43%
37%
66%
114%
7.4%
1.7%
208%
Vitamin Comparison
Vitamin comparison score is based on the number of vitamins by which one or the other food is richer. The "coverage" charts below show how much of the daily needs can be covered by 300 grams of the food.
6
100 g
300 g
1 cubic inch - 17g 1 slice (1 oz) - 28g 1 oz - 28.35g 1 cup, shredded - 113g 1 cup, diced - 132g 1 cup, melted - 244g
Vitamin C
Vit. C
Vitamin D
Vit. D
Vitamin A
Vit. A
Vitamin E
Vit. E
Vitamin B1
Vit. B1
Vitamin B2
Vit. B2
Vitamin B3
Vit. B3
Vitamin B5
Vit. B5
Vitamin B6
Vit. B6
Vitamin B12
Vit. B12
Vitamin K
Vit. K
Folate
Folate
0%
9%
110%
14%
7.3%
99%
1.1%
25%
15%
138%
6%
20%
4
100 g
300 g
3 oz - 85g 1 piece, cooked, excluding refuse (yield from 1 lb raw meat with refuse) - 333g 1 roast - 402g
Vitamin C
Vit. C
Vitamin D
Vit. D
Vitamin A
Vit. A
Vitamin E
Vit. E
Vitamin B1
Vit. B1
Vitamin B2
Vit. B2
Vitamin B3
Vit. B3
Vitamin B5
Vit. B5
Vitamin B6
Vit. B6
Vitamin B12
Vit. B12
Vitamin K
Vit. K
Folate
Folate
0%
3%
0%
1.6%
238%
89%
139%
61%
171%
71%
0%
0%
All nutrients comparison - raw data values
Nutrient
DV% diff.
Saturated fat
18.867g
1.198g
80%
Vitamin B1
0.029mg
0.95mg
77%
Calcium
710mg
6mg
70%
Vitamin B6
0.066mg
0.739mg
52%
Fats
33.31g
3.51g
46%
Vitamin B3
0.059mg
7.432mg
46%
Vitamin A
330µg
0µg
37%
Phosphorus
455mg
267mg
27%
Sodium
653mg
57mg
26%
Vitamin B12
1.1µg
0.57µg
22%
Monounsaturated fat
9.246g
1.334g
20%
Selenium
28.5µg
38.2µg
18%
Calories
404kcal
143kcal
13%
Iron
0.14mg
1.15mg
13%
Choline
16.5mg
88.9mg
13%
Vitamin B5
0.41mg
1.012mg
12%
Zinc
3.64mg
2.42mg
11%
Potassium
76mg
421mg
10%
Cholesterol
99mg
73mg
9%
Copper
0.03mg
0.111mg
9%
Protein
22.87g
26.17g
7%
Folate
27µg
0µg
7%
Polyunsaturated fat
1.421g
0.506g
6%
Vitamin E
0.71mg
0.08mg
4%
Vitamin B2
0.428mg
0.387mg
3%
Vitamin D*
24 IU
10 IU
2%
Vitamin D
0.6µg
0.2µg
2%
Vitamin K
2.4µg
0µg
2%
Carbs
3.09g
0g
1%
Manganese
0.027mg
0.013mg
1%
Protein per 100 calories
5.7g
18g
N/A
Calories per 10 g protein
177kcal
55kcal
N/A
Weight per 100 calories
25g
70g
N/A
Unsaturated / Saturated Fat ratio
0.57
1.5
N/A
Net carbs
3.09g
0g
N/A
Magnesium
27mg
29mg
0%
Sugar
0.48g
0g
N/A
Trans fat
0.917g
0.033g
N/A
Tryptophan
0.547mg
0.275mg
0%
Threonine
1.044mg
1.175mg
0%
Isoleucine
1.206mg
1.288mg
0%
Leucine
1.939mg
2.229mg
0%
Lysine
1.025mg
2.427mg
0%
Methionine
0.547mg
0.721mg
0%
Phenylalanine
1.074mg
1.1mg
0%
Valine
1.404mg
1.367mg
0%
Histidine
0.547mg
1.13mg
0%
Omega-3 - EPA
0.01g
0g
N/A
Omega-3 - DHA
0.001g
0g
N/A
Omega-3 - ALA
0.013g
N/A
Omega-3 - DPA
0.017g
0g
N/A
Omega-6 - Eicosadienoic acid
0.007g
0.013g
N/A
Omega-6 - Linoleic acid
0.411g
N/A
Macronutrient Comparison
Macronutrient breakdown side-by-side comparison
3
23%
33%
3%
37%
4%
Protein:
22.87 g
Fats:
33.31 g
Carbs:
3.09 g
Water:
37.02 g
Other:
3.71 g
2
26%
4%
69%
Protein:
26.17 g
Fats:
3.51 g
Carbs:
0 g
Water:
69.45 g
Other:
0.87 g
Contains
more
Fats Fats
+849%
Contains
more
Carbs Carbs
+∞%
Contains
more
Other Other
+326.4%
Contains
more
Protein Protein
+14.4%
Contains
more
Water Water
+87.6%
Fat Type Comparison
Fat type breakdown side-by-side comparison
2
64%
31%
5%
Saturated fat:
Sat. Fat
18.867 g
Monounsaturated fat:
Mono. Fat
9.246 g
Polyunsaturated fat:
Poly. Fat
1.421 g
1
39%
44%
17%
Saturated fat:
Sat. Fat
1.198 g
Monounsaturated fat:
Mono. Fat
1.334 g
Polyunsaturated fat:
Poly. Fat
0.506 g
Contains
more
Mono. Fat Monounsaturated fat
+593.1%
Contains
more
Poly. Fat Polyunsaturated fat
+180.8%
Contains
less
Sat. Fat Saturated fat
-93.7%