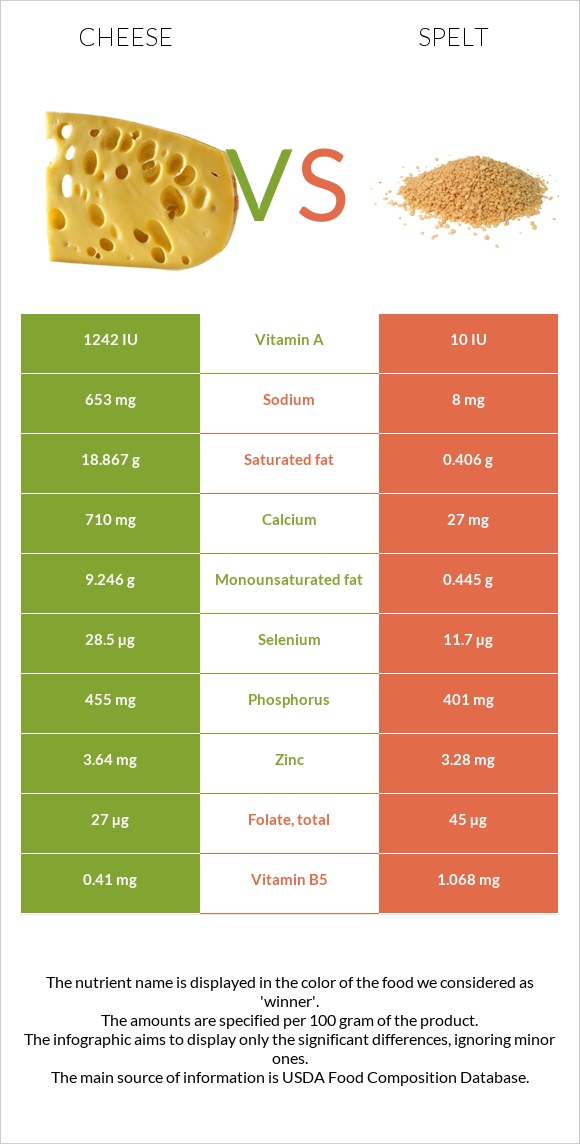
How are cheese and spelt different? Cheese is higher in calcium, vitamin B12, and selenium; however, spelt is richer in manganese, iron, copper, fiber, and vitamin B3. Daily need coverage for manganese for spelt is 129% higher. Spelt has less cholesterol. Cheese has a lower glycemic index (0) than spelt (63). Cheese, cheddar and Spelt, uncooked are the varieties used in this article.
Infographic
Mineral Comparison
Mineral comparison score is based on the number of minerals by which one or the other food is richer. The "coverage" charts below show how much of the daily needs can be covered by 300 grams of the food.
3
100 g
300 g
1 cubic inch - 17g 1 slice (1 oz) - 28g 1 oz - 28.35g 1 cup, shredded - 113g 1 cup, diced - 132g 1 cup, melted - 244g
Magnesium
Magnesium
Calcium
Calcium
Potassium
Potassium
Iron
Iron
Copper
Copper
Zinc
Zinc
Phosphorus
Phosphorus
Sodium
Sodium
Manganese
Manganese
Selenium
Selenium
19%
213%
6.7%
5.3%
10%
99%
195%
85%
3.5%
155%
6
100 g
300 g
1 cup - 174g
Magnesium
Magnesium
Calcium
Calcium
Potassium
Potassium
Iron
Iron
Copper
Copper
Zinc
Zinc
Phosphorus
Phosphorus
Sodium
Sodium
Manganese
Manganese
Selenium
Selenium
97%
8.1%
34%
167%
170%
89%
172%
1%
389%
64%
Vitamin Comparison
Vitamin comparison score is based on the number of vitamins by which one or the other food is richer. The "coverage" charts below show how much of the daily needs can be covered by 300 grams of the food.
4
100 g
300 g
1 cubic inch - 17g 1 slice (1 oz) - 28g 1 oz - 28.35g 1 cup, shredded - 113g 1 cup, diced - 132g 1 cup, melted - 244g
Vitamin C
Vit. C
Vitamin D
Vit. D
Vitamin A
Vit. A
Vitamin E
Vit. E
Vitamin B1
Vit. B1
Vitamin B2
Vit. B2
Vitamin B3
Vit. B3
Vitamin B5
Vit. B5
Vitamin B6
Vit. B6
Vitamin B12
Vit. B12
Vitamin K
Vit. K
Folate
Folate
0%
9%
110%
14%
7.3%
99%
1.1%
25%
15%
138%
6%
20%
7
100 g
300 g
1 cup - 174g
Vitamin C
Vit. C
Vitamin D
Vit. D
Vitamin A
Vit. A
Vitamin E
Vit. E
Vitamin B1
Vit. B1
Vitamin B2
Vit. B2
Vitamin B3
Vit. B3
Vitamin B5
Vit. B5
Vitamin B6
Vit. B6
Vitamin B12
Vit. B12
Vitamin K
Vit. K
Folate
Folate
0%
0%
0%
16%
91%
26%
128%
64%
53%
0%
9%
34%
All nutrients comparison - raw data values
Nutrient
DV% diff.
Manganese
0.027mg
2.983mg
129%
Saturated fat
18.867g
0.406g
84%
Calcium
710mg
27mg
68%
Iron
0.14mg
4.44mg
54%
Copper
0.03mg
0.511mg
53%
Fats
33.31g
2.43g
48%
Vitamin B12
1.1µg
0µg
46%
Fiber
0g
10.7g
43%
Vitamin B3
0.059mg
6.843mg
42%
Vitamin A
330µg
0µg
37%
Cholesterol
99mg
0mg
33%
Selenium
28.5µg
11.7µg
31%
Sodium
653mg
8mg
28%
Vitamin B1
0.029mg
0.364mg
28%
Magnesium
27mg
136mg
26%
Vitamin B2
0.428mg
0.113mg
24%
Carbs
3.09g
70.19g
22%
Starch
53.92g
22%
Monounsaturated fat
9.246g
0.445g
22%
Protein
22.87g
14.57g
17%
Vitamin B5
0.41mg
1.068mg
13%
Vitamin B6
0.066mg
0.23mg
13%
Potassium
76mg
388mg
9%
Phosphorus
455mg
401mg
8%
Folate
27µg
45µg
5%
Calories
404kcal
338kcal
3%
Vitamin D*
24 IU
3%
Vitamin D
0.6µg
3%
Zinc
3.64mg
3.28mg
3%
Choline
16.5mg
3%
Vitamin E
0.71mg
0.79mg
1%
Vitamin K
2.4µg
3.6µg
1%
Polyunsaturated fat
1.421g
1.258g
1%
Protein per 100 calories
5.7g
4.3g
N/A
Calories per 10 g protein
177kcal
232kcal
N/A
Weight per 100 calories
25g
30g
N/A
Unsaturated / Saturated Fat ratio
0.57
4.2
N/A
Net carbs
3.09g
59.49g
N/A
Sugar
0.48g
6.82g
N/A
Trans fat
0.917g
N/A
Tryptophan
0.547mg
0.132mg
0%
Threonine
1.044mg
0.443mg
0%
Isoleucine
1.206mg
0.552mg
0%
Leucine
1.939mg
1.07mg
0%
Lysine
1.025mg
0.409mg
0%
Methionine
0.547mg
0.258mg
0%
Phenylalanine
1.074mg
0.737mg
0%
Valine
1.404mg
0.681mg
0%
Histidine
0.547mg
0.36mg
0%
Fructose
0g
0.24g
0%
Omega-3 - EPA
0.01g
N/A
Omega-3 - DHA
0.001g
N/A
Omega-3 - ALA
0.065g
N/A
Omega-3 - DPA
0.017g
N/A
Omega-6 - Eicosadienoic acid
0.007g
0g
N/A
Macronutrient Comparison
Macronutrient breakdown side-by-side comparison
4
23%
33%
3%
37%
4%
Protein:
22.87 g
Fats:
33.31 g
Carbs:
3.09 g
Water:
37.02 g
Other:
3.71 g
1
15%
2%
70%
11%
2%
Protein:
14.57 g
Fats:
2.43 g
Carbs:
70.19 g
Water:
11.02 g
Other:
1.79 g
Contains
more
Protein Protein
+57%
Contains
more
Fats Fats
+1270.8%
Contains
more
Water Water
+235.9%
Contains
more
Other Other
+107.3%
Contains
more
Carbs Carbs
+2171.5%
Fat Type Comparison
Fat type breakdown side-by-side comparison
2
64%
31%
5%
Saturated fat:
Sat. Fat
18.867 g
Monounsaturated fat:
Mono. Fat
9.246 g
Polyunsaturated fat:
Poly. Fat
1.421 g
1
19%
21%
60%
Saturated fat:
Sat. Fat
0.406 g
Monounsaturated fat:
Mono. Fat
0.445 g
Polyunsaturated fat:
Poly. Fat
1.258 g
Contains
more
Mono. Fat Monounsaturated fat
+1977.8%
Contains
more
Poly. Fat Polyunsaturated fat
+13%
Contains
less
Sat. Fat Saturated fat
-97.8%
Carbohydrate type comparison
Carbohydrate type breakdown side-by-side comparison
2
54%
25%
21%
Starch:
0 g
Sucrose:
0 g
Glucose:
0.26 g
Fructose:
0 g
Lactose:
0.12 g
Maltose:
0 g
Galactose:
0.1 g
5
89%
8%
Starch:
53.92 g
Sucrose:
0.59 g
Glucose:
0.84 g
Fructose:
0.24 g
Lactose:
0 g
Maltose:
5.15 g
Galactose:
0 g
Contains
more
Lactose Lactose
+∞%
Contains
more
Galactose Galactose
+∞%
Contains
more
Starch Starch
+∞%
Contains
more
Sucrose Sucrose
+∞%
Contains
more
Glucose Glucose
+223.1%
Contains
more
Fructose Fructose
+∞%
Contains
more
Maltose Maltose
+∞%