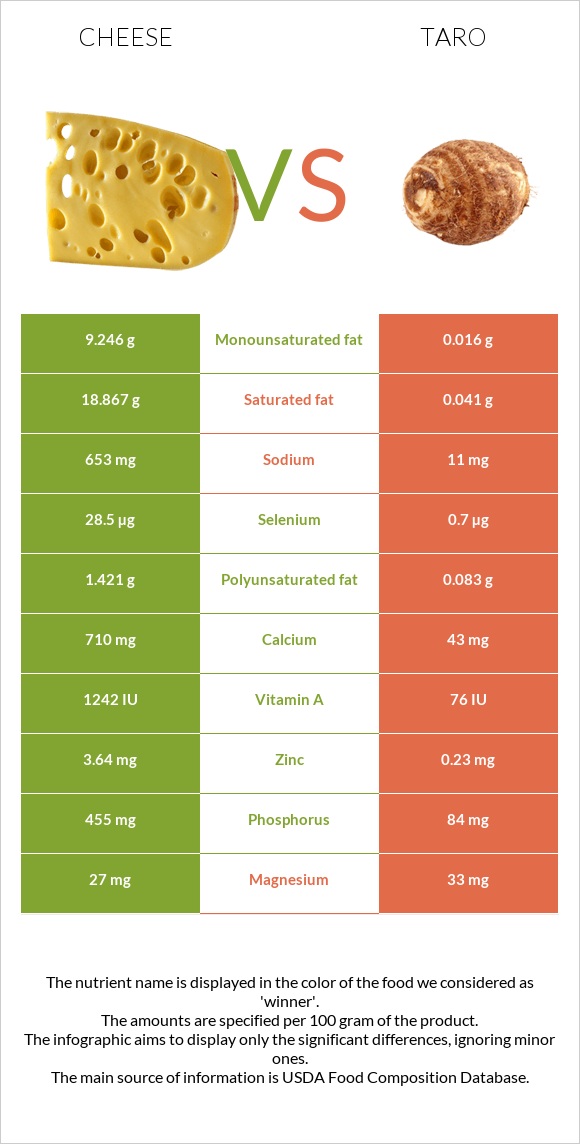
What are the differences between cheese and taro? The amount of calcium, phosphorus, selenium, vitamin B12, vitamin B2, zinc, and vitamin A in cheese is higher than in taro. Cheese's daily need coverage for saturated fat is 94% more. Taro has less cholesterol. Cheese has a lower glycemic index (0) than taro (54). We used Cheese, cheddar and Taro, raw types in this article.
Infographic
Mineral Comparison
Mineral comparison score is based on the number of minerals by which one or the other food is richer. The "coverage" charts below show how much of the daily needs can be covered by 300 grams of the food.
4
100 g
300 g
1 cubic inch - 17g 1 slice (1 oz) - 28g 1 oz - 28.35g 1 cup, shredded - 113g 1 cup, diced - 132g 1 cup, melted - 244g
Magnesium
Magnesium
Calcium
Calcium
Potassium
Potassium
Iron
Iron
Copper
Copper
Zinc
Zinc
Phosphorus
Phosphorus
Sodium
Sodium
Manganese
Manganese
Selenium
Selenium
19%
213%
6.7%
5.3%
10%
99%
195%
85%
3.5%
155%
6
100 g
300 g
1 cup, sliced - 104g
Magnesium
Magnesium
Calcium
Calcium
Potassium
Potassium
Iron
Iron
Copper
Copper
Zinc
Zinc
Phosphorus
Phosphorus
Sodium
Sodium
Manganese
Manganese
Selenium
Selenium
24%
13%
52%
21%
57%
6.3%
36%
1.4%
50%
3.8%
Vitamin Comparison
Vitamin comparison score is based on the number of vitamins by which one or the other food is richer. The "coverage" charts below show how much of the daily needs can be covered by 300 grams of the food.
7
100 g
300 g
1 cubic inch - 17g 1 slice (1 oz) - 28g 1 oz - 28.35g 1 cup, shredded - 113g 1 cup, diced - 132g 1 cup, melted - 244g
Vitamin C
Vit. C
Vitamin D
Vit. D
Vitamin A
Vit. A
Vitamin E
Vit. E
Vitamin B1
Vit. B1
Vitamin B2
Vit. B2
Vitamin B3
Vit. B3
Vitamin B5
Vit. B5
Vitamin B6
Vit. B6
Vitamin B12
Vit. B12
Vitamin K
Vit. K
Folate
Folate
0%
9%
110%
14%
7.3%
99%
1.1%
25%
15%
138%
6%
20%
5
100 g
300 g
1 cup, sliced - 104g
Vitamin C
Vit. C
Vitamin D
Vit. D
Vitamin A
Vit. A
Vitamin E
Vit. E
Vitamin B1
Vit. B1
Vitamin B2
Vit. B2
Vitamin B3
Vit. B3
Vitamin B5
Vit. B5
Vitamin B6
Vit. B6
Vitamin B12
Vit. B12
Vitamin K
Vit. K
Folate
Folate
15%
0%
1.3%
48%
24%
5.8%
11%
18%
65%
0%
2.5%
17%
All nutrients comparison - raw data values
Nutrient
DV% diff.
Saturated fat
18.867g
0.041g
86%
Calcium
710mg
43mg
67%
Phosphorus
455mg
84mg
53%
Fats
33.31g
0.2g
51%
Selenium
28.5µg
0.7µg
51%
Vitamin B12
1.1µg
0µg
46%
Protein
22.87g
1.5g
43%
Vitamin A
330µg
4µg
36%
Cholesterol
99mg
0mg
33%
Zinc
3.64mg
0.23mg
31%
Vitamin B2
0.428mg
0.025mg
31%
Sodium
653mg
11mg
28%
Monounsaturated fat
9.246g
0.016g
23%
Vitamin B6
0.066mg
0.283mg
17%
Fiber
0g
4.1g
16%
Copper
0.03mg
0.172mg
16%
Calories
404kcal
112kcal
15%
Potassium
76mg
591mg
15%
Manganese
0.027mg
0.383mg
15%
Vitamin E
0.71mg
2.38mg
11%
Polyunsaturated fat
1.421g
0.083g
9%
Carbs
3.09g
26.46g
8%
Vitamin B1
0.029mg
0.095mg
6%
Vitamin C
0mg
4.5mg
5%
Iron
0.14mg
0.55mg
5%
Vitamin D*
24 IU
0 IU
3%
Vitamin D
0.6µg
0µg
3%
Vitamin B3
0.059mg
0.6mg
3%
Vitamin B5
0.41mg
0.303mg
2%
Magnesium
27mg
33mg
1%
Vitamin K
2.4µg
1µg
1%
Folate
27µg
22µg
1%
Protein per 100 calories
5.7g
1.3g
N/A
Calories per 10 g protein
177kcal
747kcal
N/A
Weight per 100 calories
25g
89g
N/A
Unsaturated / Saturated Fat ratio
0.57
2.4
N/A
Net carbs
3.09g
22.36g
N/A
Sugar
0.48g
0.4g
N/A
Trans fat
0.917g
0g
N/A
Choline
16.5mg
17.3mg
0%
Tryptophan
0.547mg
0.023mg
0%
Threonine
1.044mg
0.069mg
0%
Isoleucine
1.206mg
0.054mg
0%
Leucine
1.939mg
0.111mg
0%
Lysine
1.025mg
0.067mg
0%
Methionine
0.547mg
0.02mg
0%
Phenylalanine
1.074mg
0.082mg
0%
Valine
1.404mg
0.082mg
0%
Histidine
0.547mg
0.034mg
0%
Omega-3 - EPA
0.01g
0g
N/A
Omega-3 - DHA
0.001g
0g
N/A
Omega-3 - DPA
0.017g
0g
N/A
Omega-6 - Eicosadienoic acid
0.007g
N/A
Macronutrient Comparison
Macronutrient breakdown side-by-side comparison
3
23%
33%
3%
37%
4%
Protein:
22.87 g
Fats:
33.31 g
Carbs:
3.09 g
Water:
37.02 g
Other:
3.71 g
2
26%
71%
Protein:
1.5 g
Fats:
0.2 g
Carbs:
26.46 g
Water:
70.64 g
Other:
1.2 g
Contains
more
Protein Protein
+1424.7%
Contains
more
Fats Fats
+16555%
Contains
more
Other Other
+209.2%
Contains
more
Carbs Carbs
+756.3%
Contains
more
Water Water
+90.8%
Fat Type Comparison
Fat type breakdown side-by-side comparison
2
64%
31%
5%
Saturated fat:
Sat. Fat
18.867 g
Monounsaturated fat:
Mono. Fat
9.246 g
Polyunsaturated fat:
Poly. Fat
1.421 g
1
29%
11%
59%
Saturated fat:
Sat. Fat
0.041 g
Monounsaturated fat:
Mono. Fat
0.016 g
Polyunsaturated fat:
Poly. Fat
0.083 g
Contains
more
Mono. Fat Monounsaturated fat
+57687.5%
Contains
more
Poly. Fat Polyunsaturated fat
+1612%
Contains
less
Sat. Fat Saturated fat
-99.8%