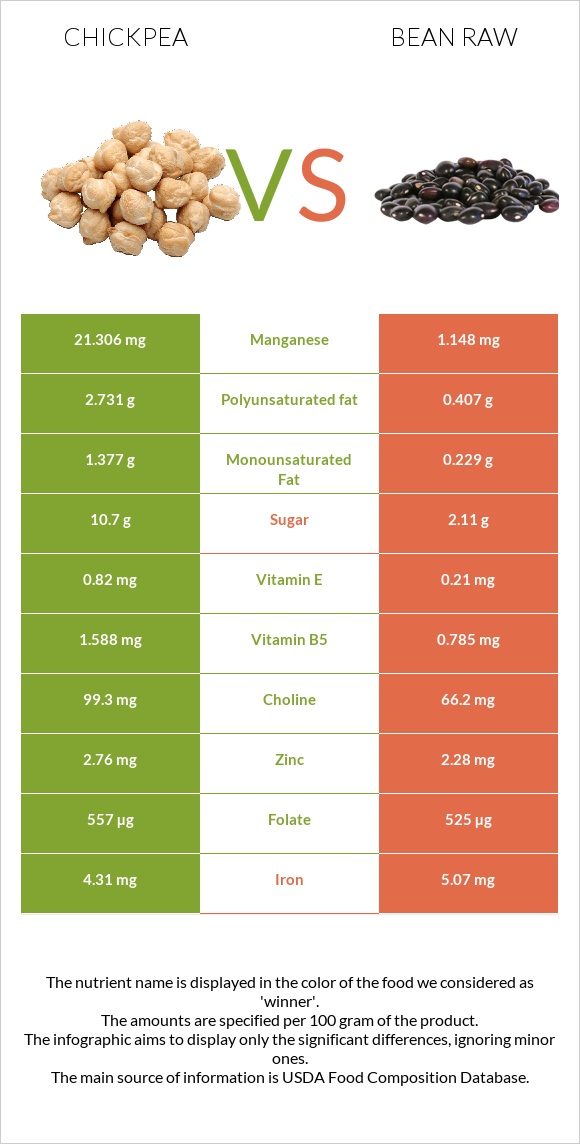
How are chickpeas and bean raw different? Bean raw has more folate, copper, vitamin B1, selenium, phosphorus, potassium, fiber, magnesium, iron, and vitamin B6 than chickpeas. Daily need coverage for folate for bean raw is 88% higher. Chickpeas (garbanzo beans, bengal gram), mature seeds, cooked, boiled, without salt and Beans, pinto, mature seeds, raw are the varieties used in this article.
Infographic
Mineral Comparison
Mineral comparison score is based on the number of minerals by which one or the other food is richer. The "coverage" charts below show how much of the daily needs can be covered by 300 grams of the food.
1
100 g
300 g
1 cup - 164g
Magnesium
Magnesium
Calcium
Calcium
Potassium
Potassium
Iron
Iron
Copper
Copper
Zinc
Zinc
Phosphorus
Phosphorus
Sodium
Sodium
Manganese
Manganese
Selenium
Selenium
34%
15%
26%
108%
117%
42%
72%
0.91%
134%
20%
9
100 g
300 g
1 tbsp - 12g 1 cup - 193g
Magnesium
Magnesium
Calcium
Calcium
Potassium
Potassium
Iron
Iron
Copper
Copper
Zinc
Zinc
Phosphorus
Phosphorus
Sodium
Sodium
Manganese
Manganese
Selenium
Selenium
126%
34%
123%
190%
298%
62%
176%
1.6%
150%
152%
Vitamin Comparison
Vitamin comparison score is based on the number of vitamins by which one or the other food is richer. The "coverage" charts below show how much of the daily needs can be covered by 300 grams of the food.
2
100 g
300 g
1 cup - 164g
Vitamin C
Vit. C
Vitamin D
Vit. D
Vitamin A
Vit. A
Vitamin E
Vit. E
Vitamin B1
Vit. B1
Vitamin B2
Vit. B2
Vitamin B3
Vit. B3
Vitamin B5
Vit. B5
Vitamin B6
Vit. B6
Vitamin B12
Vit. B12
Vitamin K
Vit. K
Folate
Folate
4.3%
0%
0.33%
7%
29%
15%
9.9%
17%
32%
0%
10%
129%
8
100 g
300 g
1 tbsp - 12g 1 cup - 193g
Vitamin C
Vit. C
Vitamin D
Vit. D
Vitamin A
Vit. A
Vitamin E
Vit. E
Vitamin B1
Vit. B1
Vitamin B2
Vit. B2
Vitamin B3
Vit. B3
Vitamin B5
Vit. B5
Vitamin B6
Vit. B6
Vitamin B12
Vit. B12
Vitamin K
Vit. K
Folate
Folate
21%
0%
0%
4.2%
178%
49%
22%
47%
109%
0%
14%
394%
All nutrients comparison - raw data values
Nutrient
DV% diff.
Folate
172µg
525µg
88%
Copper
0.352mg
0.893mg
60%
Vitamin B1
0.116mg
0.713mg
50%
Selenium
3.7µg
27.9µg
44%
Phosphorus
168mg
411mg
35%
Potassium
291mg
1393mg
32%
Fiber
7.6g
15.5g
32%
Magnesium
48mg
176mg
30%
Iron
2.89mg
5.07mg
27%
Vitamin B6
0.139mg
0.474mg
26%
Protein
8.86g
21.42g
25%
Starch
34.17g
14%
Carbs
27.42g
62.55g
12%
Vitamin B2
0.063mg
0.212mg
11%
Vitamin B5
0.286mg
0.785mg
10%
Calories
164kcal
347kcal
9%
Zinc
1.53mg
2.28mg
7%
Vitamin C
1.3mg
6.3mg
6%
Calcium
49mg
113mg
6%
Manganese
1.03mg
1.148mg
5%
Polyunsaturated fat
1.156g
0.407g
5%
Vitamin B3
0.526mg
1.174mg
4%
Choline
42.8mg
66.2mg
4%
Fats
2.59g
1.23g
2%
Vitamin E
0.35mg
0.21mg
1%
Vitamin K
4µg
5.6µg
1%
Monounsaturated fat
0.583g
0.229g
1%
Protein per 100 calories
5.4g
6.2g
N/A
Calories per 10 g protein
185kcal
162kcal
N/A
Weight per 100 calories
61g
29g
N/A
Unsaturated / Saturated Fat ratio
6.5
2.7
N/A
Net carbs
19.82g
47.05g
N/A
Sugar
4.8g
2.11g
N/A
Sodium
7mg
12mg
0%
Vitamin A
1µg
0µg
0%
Saturated fat
0.269g
0.235g
0%
Tryptophan
0.085mg
0.237mg
0%
Threonine
0.329mg
0.81mg
0%
Isoleucine
0.38mg
0.871mg
0%
Leucine
0.631mg
1.558mg
0%
Lysine
0.593mg
1.356mg
0%
Methionine
0.116mg
0.259mg
0%
Phenylalanine
0.475mg
1.095mg
0%
Valine
0.372mg
0.998mg
0%
Histidine
0.244mg
0.556mg
0%
Macronutrient Comparison
Macronutrient breakdown side-by-side comparison
2
9%
3%
27%
60%
Protein:
8.86 g
Fats:
2.59 g
Carbs:
27.42 g
Water:
60.21 g
Other:
0.92 g
3
21%
63%
11%
3%
Protein:
21.42 g
Fats:
1.23 g
Carbs:
62.55 g
Water:
11.33 g
Other:
3.47 g
Contains
more
Fats Fats
+110.6%
Contains
more
Water Water
+431.4%
Contains
more
Protein Protein
+141.8%
Contains
more
Carbs Carbs
+128.1%
Contains
more
Other Other
+277.2%
Fat Type Comparison
Fat type breakdown side-by-side comparison
2
13%
29%
58%
Saturated fat:
Sat. Fat
0.269 g
Monounsaturated fat:
Mono. Fat
0.583 g
Polyunsaturated fat:
Poly. Fat
1.156 g
1
27%
26%
47%
Saturated fat:
Sat. Fat
0.235 g
Monounsaturated fat:
Mono. Fat
0.229 g
Polyunsaturated fat:
Poly. Fat
0.407 g
Contains
more
Mono. Fat Monounsaturated fat
+154.6%
Contains
more
Poly. Fat Polyunsaturated fat
+184%
Contains
less
Sat. Fat Saturated fat
-12.6%