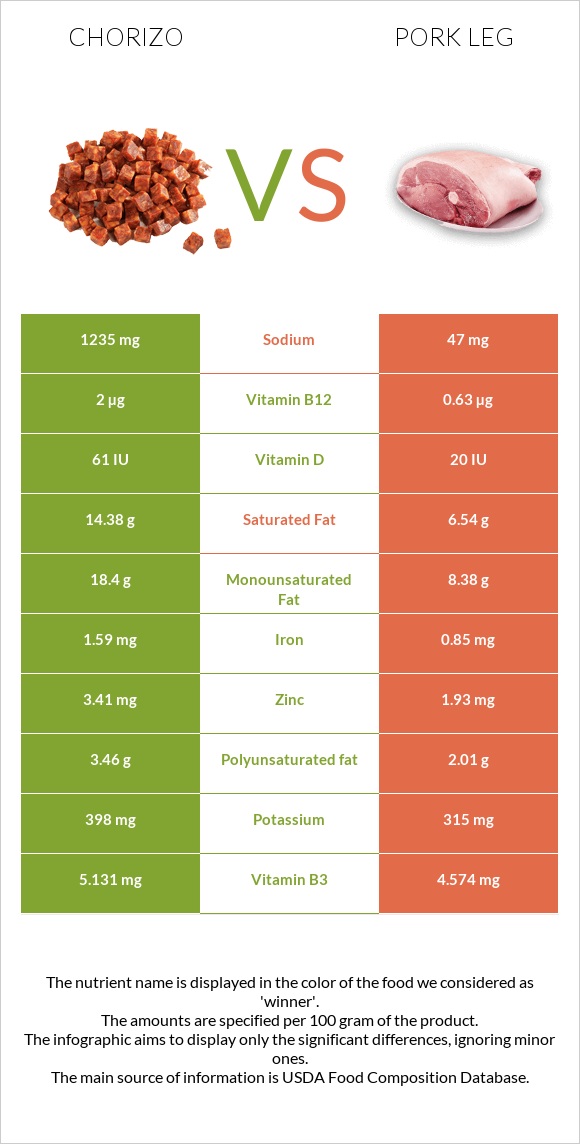
What are the differences between chorizo and pork leg? Chorizo is higher in vitamin B12, zinc, vitamin B6, iron, vitamin B5, and vitamin B2; however, pork leg is richer in selenium and vitamin B1. Chorizo's daily need coverage for vitamin B12 is 57% more. Pork leg contains 26 times less sodium than chorizo. Chorizo contains 1235mg of sodium, while pork leg contains 47mg. Pork leg has a lower glycemic index (0) than chorizo (28). We used Chorizo, pork, and beef and Pork, fresh, leg (ham), whole, separable lean, and fat, raw types in this article.
Infographic
Mineral Comparison
Mineral comparison score is based on the number of minerals by which one or the other food is richer. The "coverage" charts below show how much of the daily needs can be covered by 300 grams of the food.
6
100 g
300 g
1 oz - 28.35g 1 link (4" long) - 60g
Magnesium
Magnesium
Calcium
Calcium
Potassium
Potassium
Iron
Iron
Copper
Copper
Zinc
Zinc
Phosphorus
Phosphorus
Sodium
Sodium
Manganese
Manganese
Selenium
Selenium
13%
2.4%
35%
60%
27%
93%
64%
161%
5.2%
115%
4
100 g
300 g
1 oz - 28.35g 1 lb - 453.6g
Magnesium
Magnesium
Calcium
Calcium
Potassium
Potassium
Iron
Iron
Copper
Copper
Zinc
Zinc
Phosphorus
Phosphorus
Sodium
Sodium
Manganese
Manganese
Selenium
Selenium
14%
1.5%
28%
32%
22%
53%
85%
6.1%
3%
160%
Vitamin Comparison
Vitamin comparison score is based on the number of vitamins by which one or the other food is richer. The "coverage" charts below show how much of the daily needs can be covered by 300 grams of the food.
8
100 g
300 g
1 oz - 28.35g 1 link (4" long) - 60g
Vitamin C
Vit. C
Vitamin D
Vit. D
Vitamin A
Vit. A
Vitamin E
Vit. E
Vitamin B1
Vit. B1
Vitamin B2
Vit. B2
Vitamin B3
Vit. B3
Vitamin B5
Vit. B5
Vitamin B6
Vit. B6
Vitamin B12
Vit. B12
Vitamin K
Vit. K
Folate
Folate
0%
23%
0%
4.4%
158%
69%
96%
67%
122%
250%
4%
1.5%
3
100 g
300 g
1 oz - 28.35g 1 lb - 453.6g
Vitamin C
Vit. C
Vitamin D
Vit. D
Vitamin A
Vit. A
Vitamin E
Vit. E
Vitamin B1
Vit. B1
Vitamin B2
Vit. B2
Vitamin B3
Vit. B3
Vitamin B5
Vit. B5
Vitamin B6
Vit. B6
Vitamin B12
Vit. B12
Vitamin K
Vit. K
Folate
Folate
2.3%
7.5%
0%
0%
184%
46%
86%
41%
93%
79%
0%
5.3%
All nutrients comparison - raw data values
Nutrient
DV% diff.
Vitamin B12
2µg
0.63µg
57%
Sodium
1235mg
47mg
52%
Saturated fat
14.38g
6.54g
36%
Fats
38.27g
18.87g
30%
Monounsaturated fat
18.4g
8.38g
25%
Choline
96.7mg
18%
Selenium
21.1µg
29.4µg
15%
Protein
24.1g
17.43g
13%
Zinc
3.41mg
1.93mg
13%
Calories
455kcal
245kcal
11%
Vitamin B6
0.53mg
0.401mg
10%
Polyunsaturated fat
3.46g
2.01g
10%
Iron
1.59mg
0.85mg
9%
Vitamin B1
0.63mg
0.736mg
9%
Vitamin B5
1.12mg
0.685mg
9%
Vitamin B2
0.3mg
0.2mg
8%
Phosphorus
150mg
199mg
7%
Cholesterol
88mg
73mg
5%
Vitamin D*
61 IU
20 IU
5%
Vitamin D
1.5µg
0.5µg
5%
Vitamin B3
5.131mg
4.574mg
3%
Potassium
398mg
315mg
2%
Copper
0.08mg
0.065mg
2%
Vitamin C
0mg
0.7mg
1%
Carbs
1.86g
0g
1%
Vitamin E
0.22mg
1%
Manganese
0.04mg
0.023mg
1%
Vitamin K
1.6µg
1%
Folate
2µg
7µg
1%
Protein per 100 calories
5.3g
7.1g
N/A
Calories per 10 g protein
189kcal
141kcal
N/A
Weight per 100 calories
22g
41g
N/A
Unsaturated / Saturated Fat ratio
1.5
1.6
N/A
Net carbs
1.86g
0g
N/A
Magnesium
18mg
20mg
0%
Calcium
8mg
5mg
0%
Tryptophan
0.278mg
0.208mg
0%
Threonine
1.473mg
0.776mg
0%
Isoleucine
2.206mg
0.787mg
0%
Leucine
1.708mg
1.376mg
0%
Lysine
2.414mg
1.55mg
0%
Methionine
0.47mg
0.444mg
0%
Phenylalanine
1.149mg
0.689mg
0%
Valine
0.914mg
0.931mg
0%
Histidine
0.721mg
0.659mg
0%
Macronutrient Comparison
Macronutrient breakdown side-by-side comparison
4
24%
38%
2%
32%
4%
Protein:
24.1 g
Fats:
38.27 g
Carbs:
1.86 g
Water:
31.85 g
Other:
3.92 g
1
17%
19%
62%
Protein:
17.43 g
Fats:
18.87 g
Carbs:
0 g
Water:
62.47 g
Other:
1.23 g
Contains
more
Protein Protein
+38.3%
Contains
more
Fats Fats
+102.8%
Contains
more
Carbs Carbs
+∞%
Contains
more
Other Other
+218.7%
Contains
more
Water Water
+96.1%
Fat Type Comparison
Fat type breakdown side-by-side comparison
2
40%
51%
10%
Saturated fat:
Sat. Fat
14.38 g
Monounsaturated fat:
Mono. Fat
18.4 g
Polyunsaturated fat:
Poly. Fat
3.46 g
1
39%
49%
12%
Saturated fat:
Sat. Fat
6.54 g
Monounsaturated fat:
Mono. Fat
8.38 g
Polyunsaturated fat:
Poly. Fat
2.01 g
Contains
more
Mono. Fat Monounsaturated fat
+119.6%
Contains
more
Poly. Fat Polyunsaturated fat
+72.1%
Contains
less
Sat. Fat Saturated fat
-54.5%