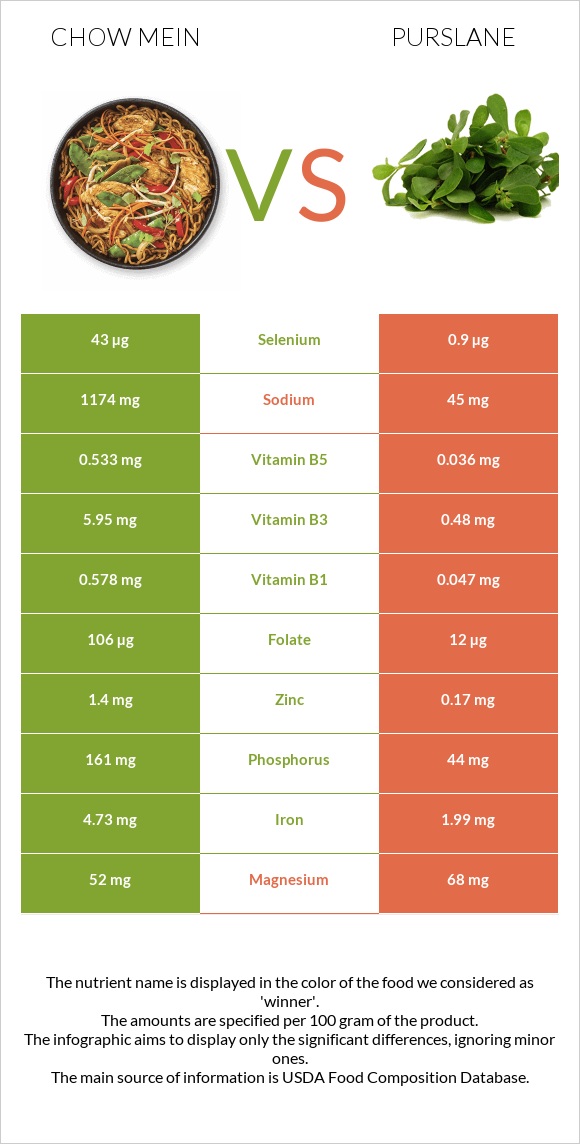
Significant differences between chow mein and purslane Chow mein has more selenium, vitamin B1, iron, vitamin B3, vitamin B2, folate, and phosphorus; however, purslane is richer in vitamin A and vitamin C. Chow mein covers your daily selenium needs 77% more than purslane. Purslane has 26 times less sodium than chow mein. Chow mein has 1174mg of sodium, while purslane has 45mg. Specific food types used in this comparison are Noodles, chinese, chow mein and Purslane, raw .
Infographic
Mineral Comparison
Mineral comparison score is based on the number of minerals by which one or the other food is richer. The "coverage" charts below show how much of the daily needs can be covered by 300 grams of the food.
5
100 g
300 g
0.5 cup dry - 28g 1.5 oz - 43g
Magnesium
Magnesium
Calcium
Calcium
Potassium
Potassium
Iron
Iron
Copper
Copper
Zinc
Zinc
Phosphorus
Phosphorus
Sodium
Sodium
Manganese
Manganese
Selenium
Selenium
37%
6%
11%
177%
56%
38%
69%
153%
0%
235%
5
100 g
300 g
1 plant - 3g 1 cup - 43g
Magnesium
Magnesium
Calcium
Calcium
Potassium
Potassium
Iron
Iron
Copper
Copper
Zinc
Zinc
Phosphorus
Phosphorus
Sodium
Sodium
Manganese
Manganese
Selenium
Selenium
49%
20%
44%
75%
38%
4.6%
19%
5.9%
40%
4.9%
Vitamin Comparison
Vitamin comparison score is based on the number of vitamins by which one or the other food is richer. The "coverage" charts below show how much of the daily needs can be covered by 300 grams of the food.
8
100 g
300 g
0.5 cup dry - 28g 1.5 oz - 43g
Vitamin C
Vit. C
Vitamin D
Vit. D
Vitamin A
Vit. A
Vitamin E
Vit. E
Vitamin B1
Vit. B1
Vitamin B2
Vit. B2
Vitamin B3
Vit. B3
Vitamin B5
Vit. B5
Vitamin B6
Vit. B6
Vitamin B12
Vit. B12
Vitamin K
Vit. K
Folate
Folate
0%
0%
0%
46%
145%
97%
112%
32%
25%
0%
3.5%
80%
1
100 g
300 g
1 plant - 3g 1 cup - 43g
Vitamin C
Vit. C
Vitamin D
Vit. D
Vitamin A
Vit. A
Vitamin E
Vit. E
Vitamin B1
Vit. B1
Vitamin B2
Vit. B2
Vitamin B3
Vit. B3
Vitamin B5
Vit. B5
Vitamin B6
Vit. B6
Vitamin B12
Vit. B12
Vitamin K
Vit. K
Folate
Folate
70%
0%
0%
0%
12%
26%
9%
2.2%
17%
0%
0%
9%
All nutrients comparison - raw data values
Nutrient
DV% diff.
Selenium
43µg
0.9µg
77%
Sodium
1174mg
45mg
49%
Vitamin B1
0.578mg
0.047mg
44%
Iron
4.73mg
1.99mg
34%
Vitamin B3
5.95mg
0.48mg
34%
Vitamin B2
0.421mg
0.112mg
24%
Folate
106µg
12µg
24%
Polyunsaturated fat
3.571g
24%
Calories
475kcal
20kcal
23%
Fats
15.43g
0.36g
23%
Vitamin C
0mg
21mg
23%
Carbs
72.8g
3.39g
23%
Monounsaturated fat
8.929g
22%
Phosphorus
161mg
44mg
17%
Fiber
3.7g
15%
Vitamin E
2.3mg
15%
Manganese
0.303mg
13%
Protein
8.11g
2.03g
12%
Potassium
120mg
494mg
11%
Zinc
1.4mg
0.17mg
11%
Vitamin B5
0.533mg
0.036mg
10%
Saturated fat
2.229g
10%
Copper
0.167mg
0.113mg
6%
Calcium
20mg
65mg
5%
Magnesium
52mg
68mg
4%
Vitamin B6
0.11mg
0.073mg
3%
Vitamin K
1.4µg
1%
Choline
8.7mg
12.8mg
1%
Protein per 100 calories
1.7g
10g
N/A
Calories per 10 g protein
586kcal
99kcal
N/A
Weight per 100 calories
21g
500g
N/A
Unsaturated / Saturated Fat ratio
5.6
N/A
Net carbs
69.1g
3.39g
N/A
Sugar
5.71g
N/A
Trans fat
0.8g
0g
N/A
Macronutrient Comparison
Macronutrient breakdown side-by-side comparison
4
8%
15%
73%
2%
Protein:
8.11 g
Fats:
15.43 g
Carbs:
72.8 g
Water:
1.18 g
Other:
2.48 g
1
2%
3%
93%
Protein:
2.03 g
Fats:
0.36 g
Carbs:
3.39 g
Water:
92.86 g
Other:
1.36 g
Contains
more
Protein Protein
+299.5%
Contains
more
Fats Fats
+4186.1%
Contains
more
Carbs Carbs
+2047.5%
Contains
more
Other Other
+82.4%
Contains
more
Water Water
+7769.5%