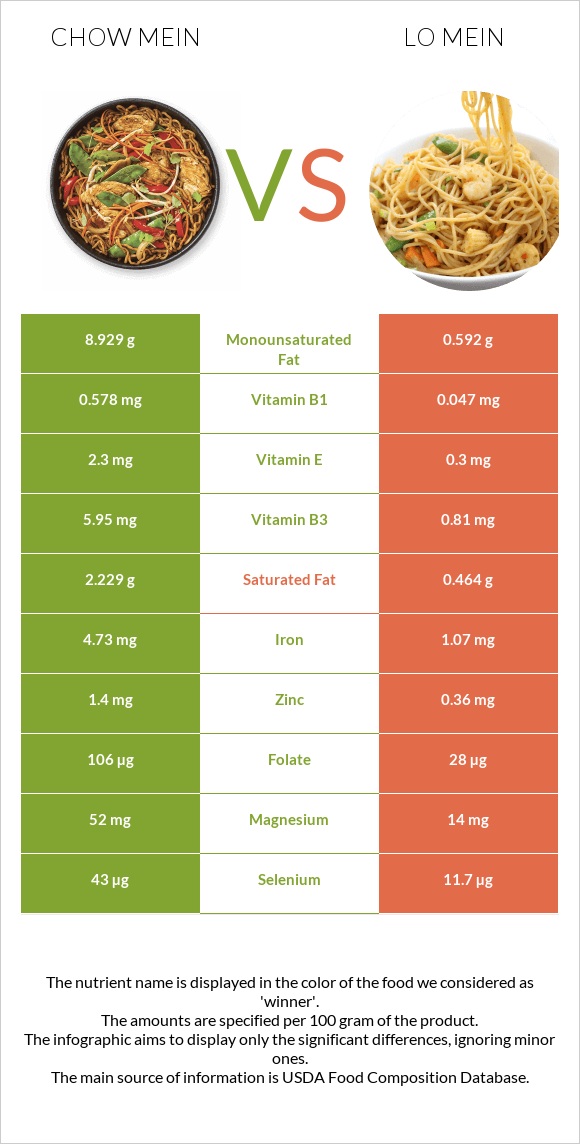
How are chow mein and lo mein different? Chow mein is higher than lo mein in selenium, iron, vitamin B1, vitamin B3, vitamin B2, folate, phosphorus, vitamin E, and copper. Chow mein covers your daily need for selenium, 57% more than lo mein. Chow mein contains 12 times more vitamin B1 than lo mein. Chow mein contains 0.578mg of vitamin B1, while lo mein contains 0.047mg. Lo mein is lower in sodium. Noodles, chinese, chow mein and Restaurant, Chinese, vegetable lo mein, without meat types were used in this article.
Infographic
Mineral Comparison
Mineral comparison score is based on the number of minerals by which one or the other food is richer. The "coverage" charts below show how much of the daily needs can be covered by 300 grams of the food.
7
100 g
300 g
0.5 cup dry - 28g 1.5 oz - 43g
Magnesium
Magnesium
Calcium
Calcium
Potassium
Potassium
Iron
Iron
Copper
Copper
Zinc
Zinc
Phosphorus
Phosphorus
Sodium
Sodium
Manganese
Manganese
Selenium
Selenium
37%
6%
11%
177%
56%
38%
69%
153%
0%
235%
2
100 g
300 g
1 cup - 136g 1 order - 741g
Magnesium
Magnesium
Calcium
Calcium
Potassium
Potassium
Iron
Iron
Copper
Copper
Zinc
Zinc
Phosphorus
Phosphorus
Sodium
Sodium
Manganese
Manganese
Selenium
Selenium
10%
6.3%
9.3%
40%
21%
9.8%
19%
56%
31%
64%
Vitamin Comparison
Vitamin comparison score is based on the number of vitamins by which one or the other food is richer. The "coverage" charts below show how much of the daily needs can be covered by 300 grams of the food.
7
100 g
300 g
0.5 cup dry - 28g 1.5 oz - 43g
Vitamin C
Vit. C
Vitamin D
Vit. D
Vitamin A
Vit. A
Vitamin E
Vit. E
Vitamin B1
Vit. B1
Vitamin B2
Vit. B2
Vitamin B3
Vit. B3
Vitamin B5
Vit. B5
Vitamin B6
Vit. B6
Vitamin B12
Vit. B12
Vitamin K
Vit. K
Folate
Folate
0%
0%
0%
46%
145%
97%
112%
32%
25%
0%
3.5%
80%
4
100 g
300 g
1 cup - 136g 1 order - 741g
Vitamin C
Vit. C
Vitamin D
Vit. D
Vitamin A
Vit. A
Vitamin E
Vit. E
Vitamin B1
Vit. B1
Vitamin B2
Vit. B2
Vitamin B3
Vit. B3
Vitamin B5
Vit. B5
Vitamin B6
Vit. B6
Vitamin B12
Vit. B12
Vitamin K
Vit. K
Folate
Folate
5.7%
1.5%
3%
6%
12%
29%
15%
16%
16%
0%
32%
21%
All nutrients comparison - raw data values
Nutrient
DV% diff.
Selenium
43µg
11.7µg
57%
Iron
4.73mg
1.07mg
46%
Vitamin B1
0.578mg
0.047mg
44%
Sodium
1174mg
430mg
32%
Vitamin B3
5.95mg
0.81mg
32%
Vitamin B2
0.421mg
0.124mg
23%
Monounsaturated fat
8.929g
0.592g
21%
Fats
15.43g
2.35g
20%
Folate
106µg
28µg
20%
Calories
475kcal
121kcal
18%
Carbs
72.8g
20.16g
18%
Phosphorus
161mg
45mg
17%
Polyunsaturated fat
3.571g
1.291g
15%
Vitamin E
2.3mg
0.3mg
13%
Copper
0.167mg
0.064mg
11%
Fiber
3.7g
1.3g
10%
Manganese
0.24mg
10%
Magnesium
52mg
14mg
9%
Zinc
1.4mg
0.36mg
9%
Vitamin K
1.4µg
12.7µg
9%
Saturated fat
2.229g
0.464g
8%
Protein
8.11g
4.77g
7%
Starch
16.73g
7%
Vitamin B5
0.533mg
0.27mg
5%
Vitamin B6
0.11mg
0.068mg
3%
Vitamin C
0mg
1.7mg
2%
Vitamin D*
0 IU
4 IU
1%
Vitamin D
0µg
0.1µg
1%
Vitamin A
0µg
9µg
1%
Protein per 100 calories
1.7g
3.9g
N/A
Calories per 10 g protein
586kcal
254kcal
N/A
Weight per 100 calories
21g
83g
N/A
Unsaturated / Saturated Fat ratio
5.6
4.1
N/A
Net carbs
69.1g
18.86g
N/A
Calcium
20mg
21mg
0%
Potassium
120mg
105mg
0%
Sugar
5.71g
2.63g
N/A
Trans fat
0.8g
0.008g
N/A
Choline
8.7mg
8.9mg
0%
Fructose
0.33g
0%
Omega-3 - ALA
0.141g
N/A
Omega-6 - Gamma-linoleic acid
0.004g
N/A
Omega-6 - Eicosadienoic acid
0.001g
N/A
Omega-6 - Linoleic acid
1.134g
N/A
Macronutrient Comparison
Macronutrient breakdown side-by-side comparison
4
8%
15%
73%
2%
Protein:
8.11 g
Fats:
15.43 g
Carbs:
72.8 g
Water:
1.18 g
Other:
2.48 g
1
5%
2%
20%
71%
Protein:
4.77 g
Fats:
2.35 g
Carbs:
20.16 g
Water:
71.33 g
Other:
1.39 g
Contains
more
Protein Protein
+70%
Contains
more
Fats Fats
+556.6%
Contains
more
Carbs Carbs
+261.1%
Contains
more
Other Other
+78.4%
Contains
more
Water Water
+5944.9%
Fat Type Comparison
Fat type breakdown side-by-side comparison
2
15%
61%
24%
Saturated fat:
Sat. Fat
2.229 g
Monounsaturated fat:
Mono. Fat
8.929 g
Polyunsaturated fat:
Poly. Fat
3.571 g
1
20%
25%
55%
Saturated fat:
Sat. Fat
0.464 g
Monounsaturated fat:
Mono. Fat
0.592 g
Polyunsaturated fat:
Poly. Fat
1.291 g
Contains
more
Mono. Fat Monounsaturated fat
+1408.3%
Contains
more
Poly. Fat Polyunsaturated fat
+176.6%
Contains
less
Sat. Fat Saturated fat
-79.2%