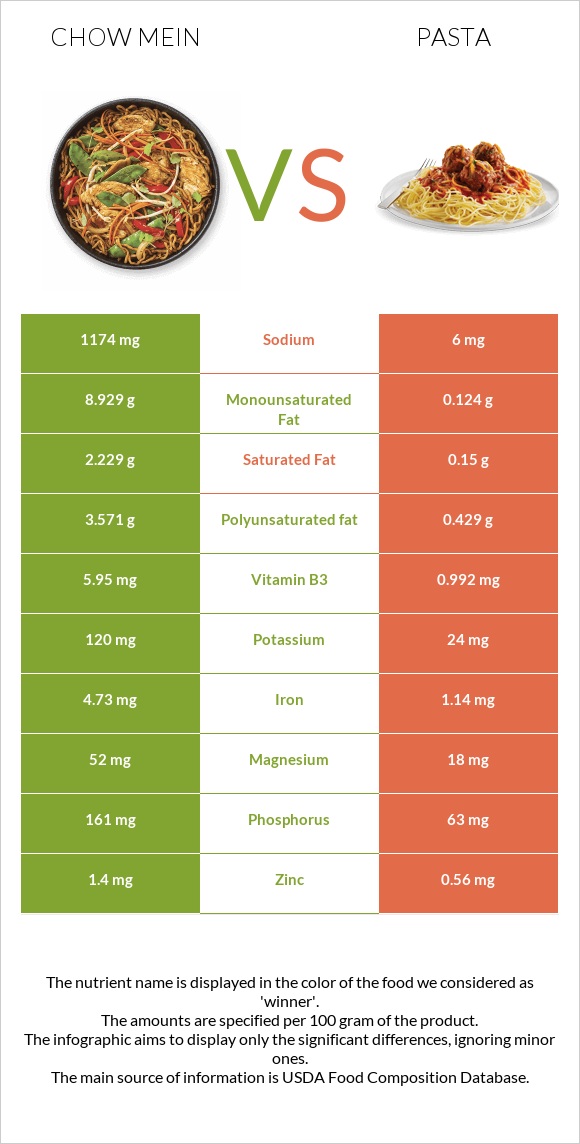
What are the differences between chow mein and pasta? Chow mein is richer than pasta in iron, vitamin B3, vitamin B1, vitamin B2, phosphorus, folate, and copper. Chow mein's daily need coverage for sodium is 51% more. Chow mein has 15 times more saturated fat than pasta. While chow mein has 2.229g of saturated fat, pasta has only 0.15g. The amount of sodium in pasta is lower. We used Noodles, chinese, chow mein and Pasta, fresh-refrigerated, plain, cooked types in this article.
Infographic
Mineral Comparison
Mineral comparison score is based on the number of minerals by which one or the other food is richer. The "coverage" charts below show how much of the daily needs can be covered by 300 grams of the food.
8
100 g
300 g
0.5 cup dry - 28g 1.5 oz - 43g
Magnesium
Magnesium
Calcium
Calcium
Potassium
Potassium
Iron
Iron
Copper
Copper
Zinc
Zinc
Phosphorus
Phosphorus
Sodium
Sodium
Manganese
Manganese
Selenium
Selenium
37%
6%
11%
177%
56%
38%
69%
153%
0%
235%
2
100 g
300 g
2 oz - 128g
Magnesium
Magnesium
Calcium
Calcium
Potassium
Potassium
Iron
Iron
Copper
Copper
Zinc
Zinc
Phosphorus
Phosphorus
Sodium
Sodium
Manganese
Manganese
Selenium
Selenium
13%
1.8%
2.1%
43%
31%
15%
27%
0.78%
29%
0%
Vitamin Comparison
Vitamin comparison score is based on the number of vitamins by which one or the other food is richer. The "coverage" charts below show how much of the daily needs can be covered by 300 grams of the food.
8
100 g
300 g
0.5 cup dry - 28g 1.5 oz - 43g
Vitamin C
Vit. C
Vitamin D
Vit. D
Vitamin A
Vit. A
Vitamin E
Vit. E
Vitamin B1
Vit. B1
Vitamin B2
Vit. B2
Vitamin B3
Vit. B3
Vitamin B5
Vit. B5
Vitamin B6
Vit. B6
Vitamin B12
Vit. B12
Vitamin K
Vit. K
Folate
Folate
0%
0%
0%
46%
145%
97%
112%
32%
25%
0%
3.5%
80%
2
100 g
300 g
2 oz - 128g
Vitamin C
Vit. C
Vitamin D
Vit. D
Vitamin A
Vit. A
Vitamin E
Vit. E
Vitamin B1
Vit. B1
Vitamin B2
Vit. B2
Vitamin B3
Vit. B3
Vitamin B5
Vit. B5
Vitamin B6
Vit. B6
Vitamin B12
Vit. B12
Vitamin K
Vit. K
Folate
Folate
0%
0%
2%
0%
52%
35%
19%
11%
7.8%
18%
0%
48%
All nutrients comparison - raw data values
Nutrient
DV% diff.
Selenium
43µg
78%
Sodium
1174mg
6mg
51%
Iron
4.73mg
1.14mg
45%
Vitamin B1
0.578mg
0.209mg
31%
Vitamin B3
5.95mg
0.992mg
31%
Fats
15.43g
1.05g
22%
Monounsaturated fat
8.929g
0.124g
22%
Vitamin B2
0.421mg
0.15mg
21%
Polyunsaturated fat
3.571g
0.429g
21%
Calories
475kcal
131kcal
17%
Carbs
72.8g
24.93g
16%
Fiber
3.7g
15%
Vitamin E
2.3mg
15%
Phosphorus
161mg
63mg
14%
Cholesterol
0mg
33mg
11%
Folate
106µg
64µg
11%
Manganese
0.224mg
10%
Saturated fat
2.229g
0.15g
9%
Magnesium
52mg
18mg
8%
Copper
0.167mg
0.093mg
8%
Zinc
1.4mg
0.56mg
8%
Vitamin B5
0.533mg
0.183mg
7%
Protein
8.11g
5.15g
6%
Vitamin B6
0.11mg
0.034mg
6%
Vitamin B12
0µg
0.14µg
6%
Potassium
120mg
24mg
3%
Choline
8.7mg
2%
Calcium
20mg
6mg
1%
Vitamin A
0µg
6µg
1%
Vitamin K
1.4µg
1%
Protein per 100 calories
1.7g
3.9g
N/A
Calories per 10 g protein
586kcal
254kcal
N/A
Weight per 100 calories
21g
76g
N/A
Unsaturated / Saturated Fat ratio
5.6
3.7
N/A
Net carbs
69.1g
24.93g
N/A
Sugar
5.71g
N/A
Trans fat
0.8g
N/A
Tryptophan
0.065mg
0%
Threonine
0.134mg
0%
Isoleucine
0.197mg
0%
Leucine
0.348mg
0%
Lysine
0.097mg
0%
Methionine
0.079mg
0%
Phenylalanine
0.247mg
0%
Valine
0.217mg
0%
Histidine
0.103mg
0%
Macronutrient Comparison
Macronutrient breakdown side-by-side comparison
4
8%
15%
73%
2%
Protein:
8.11 g
Fats:
15.43 g
Carbs:
72.8 g
Water:
1.18 g
Other:
2.48 g
1
5%
25%
69%
Protein:
5.15 g
Fats:
1.05 g
Carbs:
24.93 g
Water:
68.56 g
Other:
0.31 g
Contains
more
Protein Protein
+57.5%
Contains
more
Fats Fats
+1369.5%
Contains
more
Carbs Carbs
+192%
Contains
more
Other Other
+700%
Contains
more
Water Water
+5710.2%
Fat Type Comparison
Fat type breakdown side-by-side comparison
2
15%
61%
24%
Saturated fat:
Sat. Fat
2.229 g
Monounsaturated fat:
Mono. Fat
8.929 g
Polyunsaturated fat:
Poly. Fat
3.571 g
1
21%
18%
61%
Saturated fat:
Sat. Fat
0.15 g
Monounsaturated fat:
Mono. Fat
0.124 g
Polyunsaturated fat:
Poly. Fat
0.429 g
Contains
more
Mono. Fat Monounsaturated fat
+7100.8%
Contains
more
Poly. Fat Polyunsaturated fat
+732.4%
Contains
less
Sat. Fat Saturated fat
-93.3%