Cloudberry vs. Black gram — In-Depth Nutrition Comparison
Compare
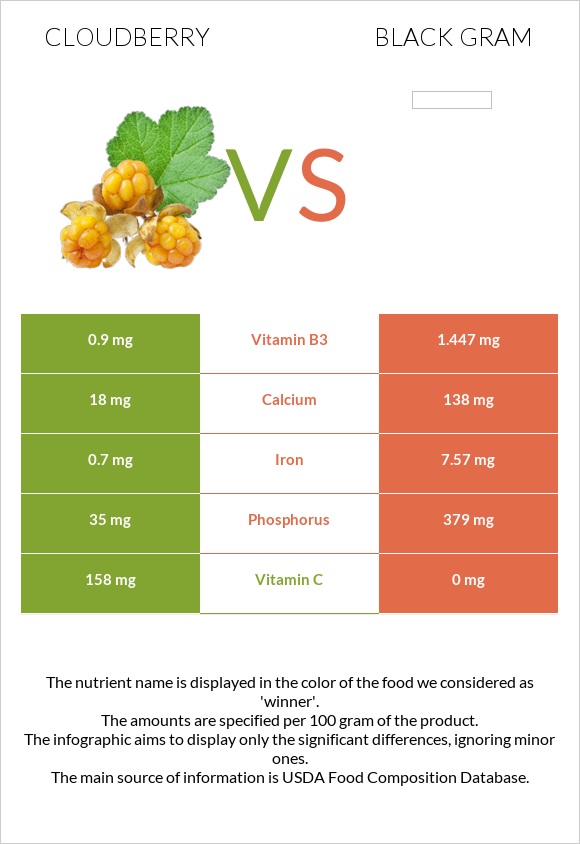
Significant differences between cloudberries and black gram
- Cloudberries have more vitamin C; however, black gram is richer in iron, phosphorus, vitamin B1, vitamin B2, and calcium.
- Cloudberries cover your daily vitamin C needs 176% more than black gram.
Specific food types used in this comparison are Cloudberries, raw (Alaska Native) and Mungo beans, mature seeds, raw.
Infographic
Infographic link
Mineral Comparison
Mineral comparison score is based on the number of minerals by which one or the other food is richer. The "coverage" charts below show how much of the daily needs can be covered by 300 grams of the food.
| Contains less SodiumSodium | -100% |
| Contains more CalciumCalcium | +666.7% |
| Contains more IronIron | +981.4% |
| Contains more PhosphorusPhosphorus | +982.9% |
Vitamin Comparison
Vitamin comparison score is based on the number of vitamins by which one or the other food is richer. The "coverage" charts below show how much of the daily needs can be covered by 300 grams of the food.
| Contains more Vitamin CVitamin C | +∞% |
| Contains more Vitamin B1Vitamin B1 | +446% |
| Contains more Vitamin B2Vitamin B2 | +262.9% |
| Contains more Vitamin B3Vitamin B3 | +60.8% |
All nutrients comparison - raw data values
| Nutrient |  |
 |
DV% diff. |
| Vitamin C | 158mg | 0mg | 176% |
| Copper | 0.981mg | 109% | |
| Iron | 0.7mg | 7.57mg | 86% |
| Fiber | 18.3g | 73% | |
| Manganese | 1.527mg | 66% | |
| Magnesium | 267mg | 64% | |
| Folate | 216µg | 54% | |
| Phosphorus | 35mg | 379mg | 49% |
| Protein | 2.4g | 25.21g | 46% |
| Zinc | 3.35mg | 30% | |
| Potassium | 983mg | 29% | |
| Vitamin B6 | 0.281mg | 22% | |
| Vitamin B1 | 0.05mg | 0.273mg | 19% |
| Vitamin B5 | 0.906mg | 18% | |
| Carbs | 8.6g | 58.99g | 17% |
| Calories | 51kcal | 341kcal | 15% |
| Selenium | 8.2µg | 15% | |
| Vitamin B2 | 0.07mg | 0.254mg | 14% |
| Calcium | 18mg | 138mg | 12% |
| Polyunsaturated fat | 1.071g | 7% | |
| Vitamin B3 | 0.9mg | 1.447mg | 3% |
| Sodium | 38mg | 2% | |
| Fats | 0.8g | 1.64g | 1% |
| Saturated fat | 0.114g | 1% | |
| Net carbs | 8.6g | 40.69g | N/A |
| Vitamin A | 1µg | 0% | |
| Monounsaturated fat | 0.085g | 0% | |
| Tryptophan | 0.263mg | 0% | |
| Threonine | 0.875mg | 0% | |
| Isoleucine | 1.287mg | 0% | |
| Leucine | 2.089mg | 0% | |
| Lysine | 1.674mg | 0% | |
| Methionine | 0.367mg | 0% | |
| Phenylalanine | 1.473mg | 0% | |
| Valine | 1.416mg | 0% | |
| Histidine | 0.706mg | 0% |
Macronutrient Comparison
Macronutrient breakdown side-by-side comparison
Protein:
2.4 g
Fats:
0.8 g
Carbs:
8.6 g
Water:
87 g
Other:
1.2 g
Protein:
25.21 g
Fats:
1.64 g
Carbs:
58.99 g
Water:
10.8 g
Other:
3.36 g
| Contains more WaterWater | +705.6% |
| Contains more ProteinProtein | +950.4% |
| Contains more FatsFats | +105% |
| Contains more CarbsCarbs | +585.9% |
| Contains more OtherOther | +180% |