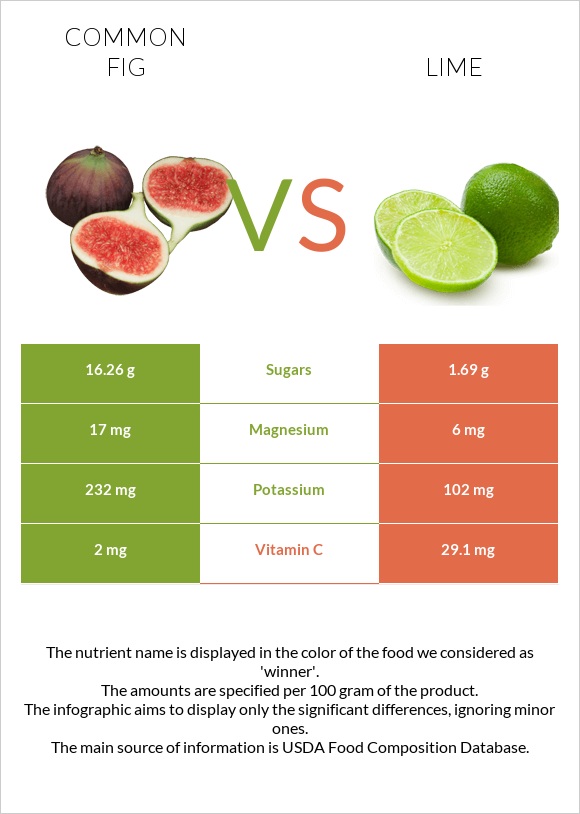
How are figs and lime different? Figs have more vitamin B6 and manganese; however, lime is richer in vitamin C. Lime covers your daily need for vitamin C, 30% more than figs. Figs have 16 times more manganese than lime. Figs have 0.128mg of manganese, while lime has 0.008mg. Lime contains less sugar. Figs have a higher glycemic index. The glycemic index of figs is 61, while the glycemic index of lime is 32. Figs, raw and Limes, raw types were used in this article.
Infographic
Mineral Comparison
Mineral comparison score is based on the number of minerals by which one or the other food is richer. The "coverage" charts below show how much of the daily needs can be covered by 300 grams of the food.
5
100 g
300 g
1 small (1-1/2" dia) - 40g 1 medium (2-1/4" dia) - 50g 1 large (2-1/2" dia) - 64g
Magnesium
Magnesium
Calcium
Calcium
Potassium
Potassium
Iron
Iron
Copper
Copper
Zinc
Zinc
Phosphorus
Phosphorus
Sodium
Sodium
Manganese
Manganese
Selenium
Selenium
12%
11%
20%
14%
23%
4.1%
6%
0.13%
17%
1.1%
3
100 g
300 g
1 fruit (2" dia) - 67g 1 NLEA serving - 67g
Magnesium
Magnesium
Calcium
Calcium
Potassium
Potassium
Iron
Iron
Copper
Copper
Zinc
Zinc
Phosphorus
Phosphorus
Sodium
Sodium
Manganese
Manganese
Selenium
Selenium
4.3%
9.9%
9%
23%
22%
3%
7.7%
0.26%
1%
2.2%
Vitamin Comparison
Vitamin comparison score is based on the number of vitamins by which one or the other food is richer. The "coverage" charts below show how much of the daily needs can be covered by 300 grams of the food.
7
100 g
300 g
1 small (1-1/2" dia) - 40g 1 medium (2-1/4" dia) - 50g 1 large (2-1/2" dia) - 64g
Vitamin C
Vit. C
Vitamin D
Vit. D
Vitamin A
Vit. A
Vitamin E
Vit. E
Vitamin B1
Vit. B1
Vitamin B2
Vit. B2
Vitamin B3
Vit. B3
Vitamin B5
Vit. B5
Vitamin B6
Vit. B6
Vitamin B12
Vit. B12
Vitamin K
Vit. K
Folate
Folate
6.7%
0%
2.3%
2.2%
15%
12%
7.5%
18%
26%
0%
12%
4.5%
3
100 g
300 g
1 fruit (2" dia) - 67g 1 NLEA serving - 67g
Vitamin C
Vit. C
Vitamin D
Vit. D
Vitamin A
Vit. A
Vitamin E
Vit. E
Vitamin B1
Vit. B1
Vitamin B2
Vit. B2
Vitamin B3
Vit. B3
Vitamin B5
Vit. B5
Vitamin B6
Vit. B6
Vitamin B12
Vit. B12
Vitamin K
Vit. K
Folate
Folate
97%
0%
0.67%
4.4%
7.5%
4.6%
3.8%
13%
9.9%
0%
1.5%
6%
All nutrients comparison - raw data values
Nutrient
DV% diff.
Vitamin C
2mg
29.1mg
30%
Manganese
0.128mg
0.008mg
5%
Vitamin B6
0.113mg
0.043mg
5%
Potassium
232mg
102mg
4%
Carbs
19.18g
10.54g
3%
Magnesium
17mg
6mg
3%
Iron
0.37mg
0.6mg
3%
Vitamin B1
0.06mg
0.03mg
3%
Vitamin K
4.7µg
0.6µg
3%
Calories
74kcal
30kcal
2%
Vitamin B2
0.05mg
0.02mg
2%
Vitamin B5
0.3mg
0.217mg
2%
Copper
0.07mg
0.065mg
1%
Phosphorus
14mg
18mg
1%
Vitamin A
7µg
2µg
1%
Vitamin E
0.11mg
0.22mg
1%
Vitamin B3
0.4mg
0.2mg
1%
Folate
6µg
8µg
1%
Polyunsaturated fat
0.144g
0.055g
1%
Protein
0.75g
0.7g
0%
Protein per 100 calories
1g
2.3g
N/A
Calories per 10 g protein
987kcal
429kcal
N/A
Weight per 100 calories
135g
333g
N/A
Fats
0.3g
0.2g
0%
Net carbs
16.28g
7.74g
N/A
Calcium
35mg
33mg
0%
Sugar
16.26g
1.69g
N/A
Fiber
2.9g
2.8g
0%
Zinc
0.15mg
0.11mg
0%
Sodium
1mg
2mg
0%
Selenium
0.2µg
0.4µg
0%
Choline
4.7mg
5.1mg
0%
Saturated fat
0.06g
0.022g
0%
Monounsaturated fat
0.066g
0.019g
0%
Tryptophan
0.006mg
0.003mg
0%
Threonine
0.024mg
0%
Isoleucine
0.023mg
0%
Leucine
0.033mg
0%
Lysine
0.03mg
0.014mg
0%
Methionine
0.006mg
0.002mg
0%
Phenylalanine
0.018mg
0%
Valine
0.028mg
0%
Histidine
0.011mg
0%
Macronutrient Comparison
Macronutrient breakdown side-by-side comparison
4
19%
79%
Protein:
0.75 g
Fats:
0.3 g
Carbs:
19.18 g
Water:
79.11 g
Other:
0.66 g
1
11%
88%
Protein:
0.7 g
Fats:
0.2 g
Carbs:
10.54 g
Water:
88.26 g
Other:
0.3 g
Contains
more
Fats Fats
+50%
Contains
more
Carbs Carbs
+82%
Contains
more
Other Other
+120%
Contains
more
Water Water
+11.6%
Fat Type Comparison
Fat type breakdown side-by-side comparison
2
22%
24%
53%
Saturated fat:
Sat. Fat
0.06 g
Monounsaturated fat:
Mono. Fat
0.066 g
Polyunsaturated fat:
Poly. Fat
0.144 g
1
23%
20%
57%
Saturated fat:
Sat. Fat
0.022 g
Monounsaturated fat:
Mono. Fat
0.019 g
Polyunsaturated fat:
Poly. Fat
0.055 g
Contains
more
Mono. Fat Monounsaturated fat
+247.4%
Contains
more
Poly. Fat Polyunsaturated fat
+161.8%
Contains
less
Sat. Fat Saturated fat
-63.3%