Olive oil vs. Oil, soybean, salad or cooking — In-Depth Nutrition Comparison
Compare
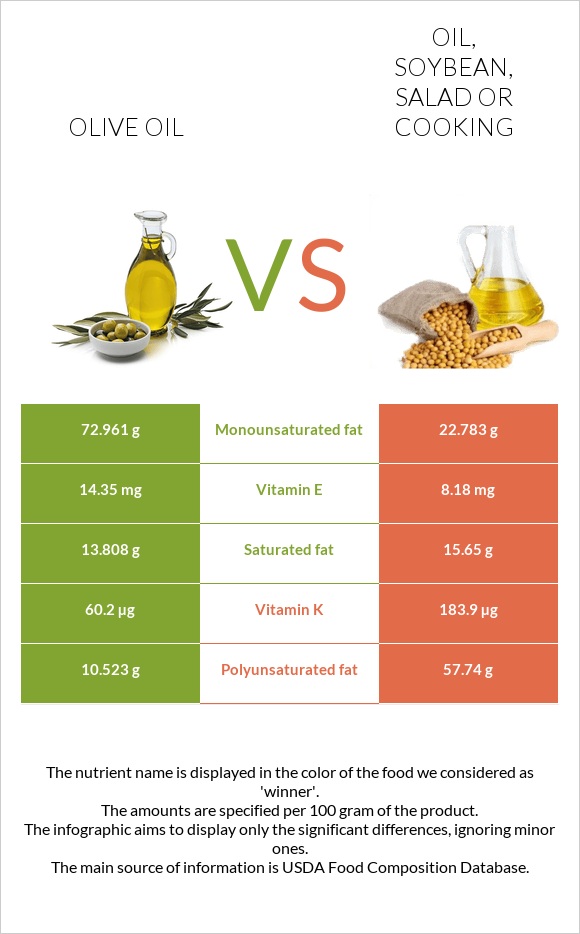
What are the differences between olive oil and oil, soybean, salad or cooking?
- Olive oil is higher in vitamin E, iron, and monounsaturated fat, yet oil, soybean, salad or cooking is higher in vitamin K and polyunsaturated fat.
- Oil, soybean, salad or cooking's daily need coverage for vitamin K is 103% more.
- Olive oil has 11 times more iron than oil, soybean, salad or cooking. While olive oil has 0.56mg of iron, oil, soybean, salad or cooking has only 0.05mg.
- The amount of saturated fat in olive oil is lower.
We used Oil, olive, salad or cooking and Oil, soybean, salad or cooking types in this article.
Infographic
Infographic link
Mineral Comparison
Mineral comparison score is based on the number of minerals by which one or the other food is richer. The "coverage" charts below show how much of the daily needs can be covered by 300 grams of the food.
| Contains more CalciumCalcium | +∞% |
| Contains more PotassiumPotassium | +∞% |
| Contains more IronIron | +1020% |
| Contains more ZincZinc | +∞% |
| Contains less SodiumSodium | -100% |
Vitamin Comparison
Vitamin comparison score is based on the number of vitamins by which one or the other food is richer. The "coverage" charts below show how much of the daily needs can be covered by 300 grams of the food.
| Contains more Vitamin EVitamin E | +75.4% |
| Contains more Vitamin KVitamin K | +205.5% |
All nutrients comparison - raw data values
| Nutrient |  |
 |
DV% diff. |
| Polyunsaturated fat | 10.523g | 57.74g | 315% |
| Monounsaturated fat | 72.961g | 22.783g | 125% |
| Vitamin K | 60.2µg | 183.9µg | 103% |
| Vitamin E | 14.35mg | 8.18mg | 41% |
| Saturated fat | 13.808g | 15.65g | 8% |
| Iron | 0.56mg | 0.05mg | 6% |
| Calories | 884kcal | 884kcal | 0% |
| Fats | 100g | 100g | 0% |
| Calcium | 1mg | 0mg | 0% |
| Potassium | 1mg | 0mg | 0% |
| Zinc | 0mg | 0.01mg | 0% |
| Sodium | 2mg | 0mg | 0% |
| Trans fat | 0.533g | N/A | |
| Choline | 0.3mg | 0.2mg | 0% |
| Omega-3 - ALA | 6.789g | N/A | |
| Omega-6 - Linoleic acid | 50.418g | N/A |
Macronutrient Comparison
Macronutrient breakdown side-by-side comparison
Protein:
0 g
Fats:
100 g
Carbs:
0 g
Water:
0 g
Other:
0 g
Protein:
0 g
Fats:
100 g
Carbs:
0 g
Water:
0 g
Other:
0 g
~equal in
Protein
~0g
~equal in
Fats
~100g
~equal in
Carbs
~0g
~equal in
Water
~0g
~equal in
Other
~0g
Fat Type Comparison
Fat type breakdown side-by-side comparison
Saturated fat:
Sat. Fat
13.808 g
Monounsaturated fat:
Mono. Fat
72.961 g
Polyunsaturated fat:
Poly. Fat
10.523 g
Saturated fat:
Sat. Fat
15.65 g
Monounsaturated fat:
Mono. Fat
22.783 g
Polyunsaturated fat:
Poly. Fat
57.74 g
| Contains less Sat. FatSaturated fat | -11.8% |
| Contains more Mono. FatMonounsaturated fat | +220.2% |
| Contains more Poly. FatPolyunsaturated fat | +448.7% |