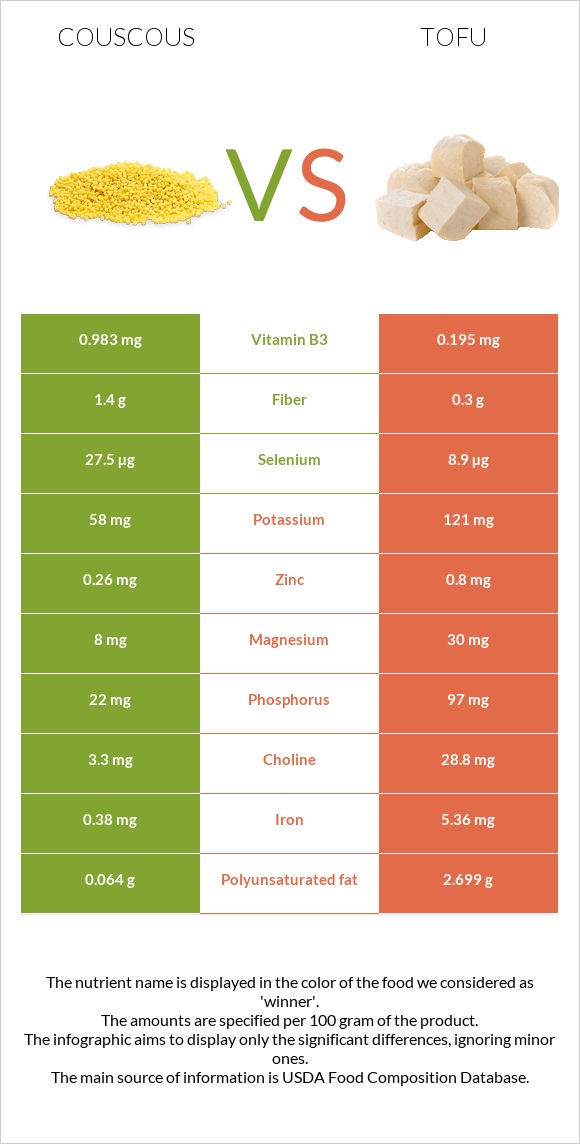
A recap on the differences between couscous and tofu Couscous is higher in selenium, yet tofu is higher in calcium, manganese, copper, iron, phosphorus, zinc, magnesium, and vitamin B1. Tofu covers your daily calcium needs 68% more than couscous. Couscous contains 2 times more selenium than tofu. While couscous contains 27.5µg of selenium, tofu contains only 17.4µg. The amount of saturated fat in couscous is lower. The glycemic index of tofu is lower. Food varieties used in this article are Couscous, cooked and Tofu, raw, firm, prepared with calcium sulfate .
Infographic
Mineral Comparison
Mineral comparison score is based on the number of minerals by which one or the other food is richer. The "coverage" charts below show how much of the daily needs can be covered by 300 grams of the food.
2
100 g
300 g
1 oz, dry, yields - 86g 1 cup, cooked - 157g 1 cup, dry, yields - 528g
Magnesium
Magnesium
Calcium
Calcium
Potassium
Potassium
Iron
Iron
Copper
Copper
Zinc
Zinc
Phosphorus
Phosphorus
Sodium
Sodium
Manganese
Manganese
Selenium
Selenium
5.7%
2.4%
5.1%
14%
14%
7.1%
9.4%
0.65%
11%
150%
8
100 g
300 g
0.25 block - 81g 0.5 cup - 126g
Magnesium
Magnesium
Calcium
Calcium
Potassium
Potassium
Iron
Iron
Copper
Copper
Zinc
Zinc
Phosphorus
Phosphorus
Sodium
Sodium
Manganese
Manganese
Selenium
Selenium
41%
205%
21%
100%
126%
43%
81%
1.8%
154%
95%
Vitamin Comparison
Vitamin comparison score is based on the number of vitamins by which one or the other food is richer. The "coverage" charts below show how much of the daily needs can be covered by 300 grams of the food.
4
100 g
300 g
1 oz, dry, yields - 86g 1 cup, cooked - 157g 1 cup, dry, yields - 528g
Vitamin C
Vit. C
Vitamin D
Vit. D
Vitamin A
Vit. A
Vitamin E
Vit. E
Vitamin B1
Vit. B1
Vitamin B2
Vit. B2
Vitamin B3
Vit. B3
Vitamin B5
Vit. B5
Vitamin B6
Vit. B6
Vitamin B12
Vit. B12
Vitamin K
Vit. K
Folate
Folate
0%
0%
0%
2.6%
16%
6.2%
18%
22%
12%
0%
0.25%
11%
5
100 g
300 g
0.25 block - 81g 0.5 cup - 126g
Vitamin C
Vit. C
Vitamin D
Vit. D
Vitamin A
Vit. A
Vitamin E
Vit. E
Vitamin B1
Vit. B1
Vitamin B2
Vit. B2
Vitamin B3
Vit. B3
Vitamin B5
Vit. B5
Vitamin B6
Vit. B6
Vitamin B12
Vit. B12
Vitamin K
Vit. K
Folate
Folate
0.67%
0%
0%
0%
40%
24%
7.1%
8%
21%
0%
0%
22%
All nutrients comparison - raw data values
Nutrient
DV% diff.
Calcium
8mg
683mg
68%
Manganese
0.084mg
1.181mg
48%
Copper
0.041mg
0.378mg
37%
Polyunsaturated fat
0.064g
4.921g
32%
Iron
0.38mg
2.66mg
29%
Protein
3.79g
17.27g
27%
Phosphorus
22mg
190mg
24%
Selenium
27.5µg
17.4µg
18%
Fats
0.16g
8.72g
13%
Magnesium
8mg
58mg
12%
Zinc
0.26mg
1.57mg
12%
Vitamin B1
0.063mg
0.158mg
8%
Carbs
23.22g
2.78g
7%
Vitamin B2
0.027mg
0.102mg
6%
Saturated fat
0.029g
1.261g
6%
Potassium
58mg
237mg
5%
Vitamin B5
0.371mg
0.133mg
5%
Monounsaturated fat
0.022g
1.925g
5%
Fiber
1.4g
2.3g
4%
Vitamin B3
0.983mg
0.381mg
4%
Folate
15µg
29µg
4%
Vitamin B6
0.051mg
0.092mg
3%
Calories
112kcal
144kcal
2%
Vitamin E
0.13mg
1%
Choline
3.3mg
1%
Protein per 100 calories
3.4g
12g
N/A
Calories per 10 g protein
296kcal
83kcal
N/A
Weight per 100 calories
89g
69g
N/A
Unsaturated / Saturated Fat ratio
3
5.4
N/A
Vitamin C
0mg
0.2mg
0%
Net carbs
21.82g
0.48g
N/A
Sugar
0.1g
N/A
Sodium
5mg
14mg
0%
Vitamin K
0.1µg
0%
Tryptophan
0.049mg
0.235mg
0%
Threonine
0.1mg
0.785mg
0%
Isoleucine
0.147mg
0.849mg
0%
Leucine
0.259mg
1.392mg
0%
Lysine
0.073mg
0.883mg
0%
Methionine
0.059mg
0.211mg
0%
Phenylalanine
0.184mg
0.835mg
0%
Valine
0.162mg
0.87mg
0%
Histidine
0.077mg
0.431mg
0%
Macronutrient Comparison
Macronutrient breakdown side-by-side comparison
2
4%
23%
73%
Protein:
3.79 g
Fats:
0.16 g
Carbs:
23.22 g
Water:
72.57 g
Other:
0.26 g
3
17%
9%
3%
70%
Protein:
17.27 g
Fats:
8.72 g
Carbs:
2.78 g
Water:
69.83 g
Other:
1.4 g
Contains
more
Carbs Carbs
+735.3%
Contains
more
Protein Protein
+355.7%
Contains
more
Fats Fats
+5350%
Contains
more
Other Other
+438.5%
Fat Type Comparison
Fat type breakdown side-by-side comparison
1
25%
19%
56%
Saturated fat:
Sat. Fat
0.029 g
Monounsaturated fat:
Mono. Fat
0.022 g
Polyunsaturated fat:
Poly. Fat
0.064 g
2
16%
24%
61%
Saturated fat:
Sat. Fat
1.261 g
Monounsaturated fat:
Mono. Fat
1.925 g
Polyunsaturated fat:
Poly. Fat
4.921 g
Contains
less
Sat. Fat Saturated fat
-97.7%
Contains
more
Mono. Fat Monounsaturated fat
+8650%
Contains
more
Poly. Fat Polyunsaturated fat
+7589.1%