Tofu nutrition: calories, carbs, GI, protein, fiber, fats
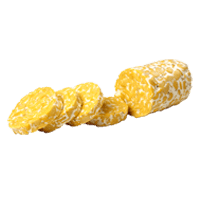
Tofu, raw, firm, prepared with calcium sulfate
*all the values are displayed for the amount of 100 grams
Medically reviewed by Jack Yacoubian

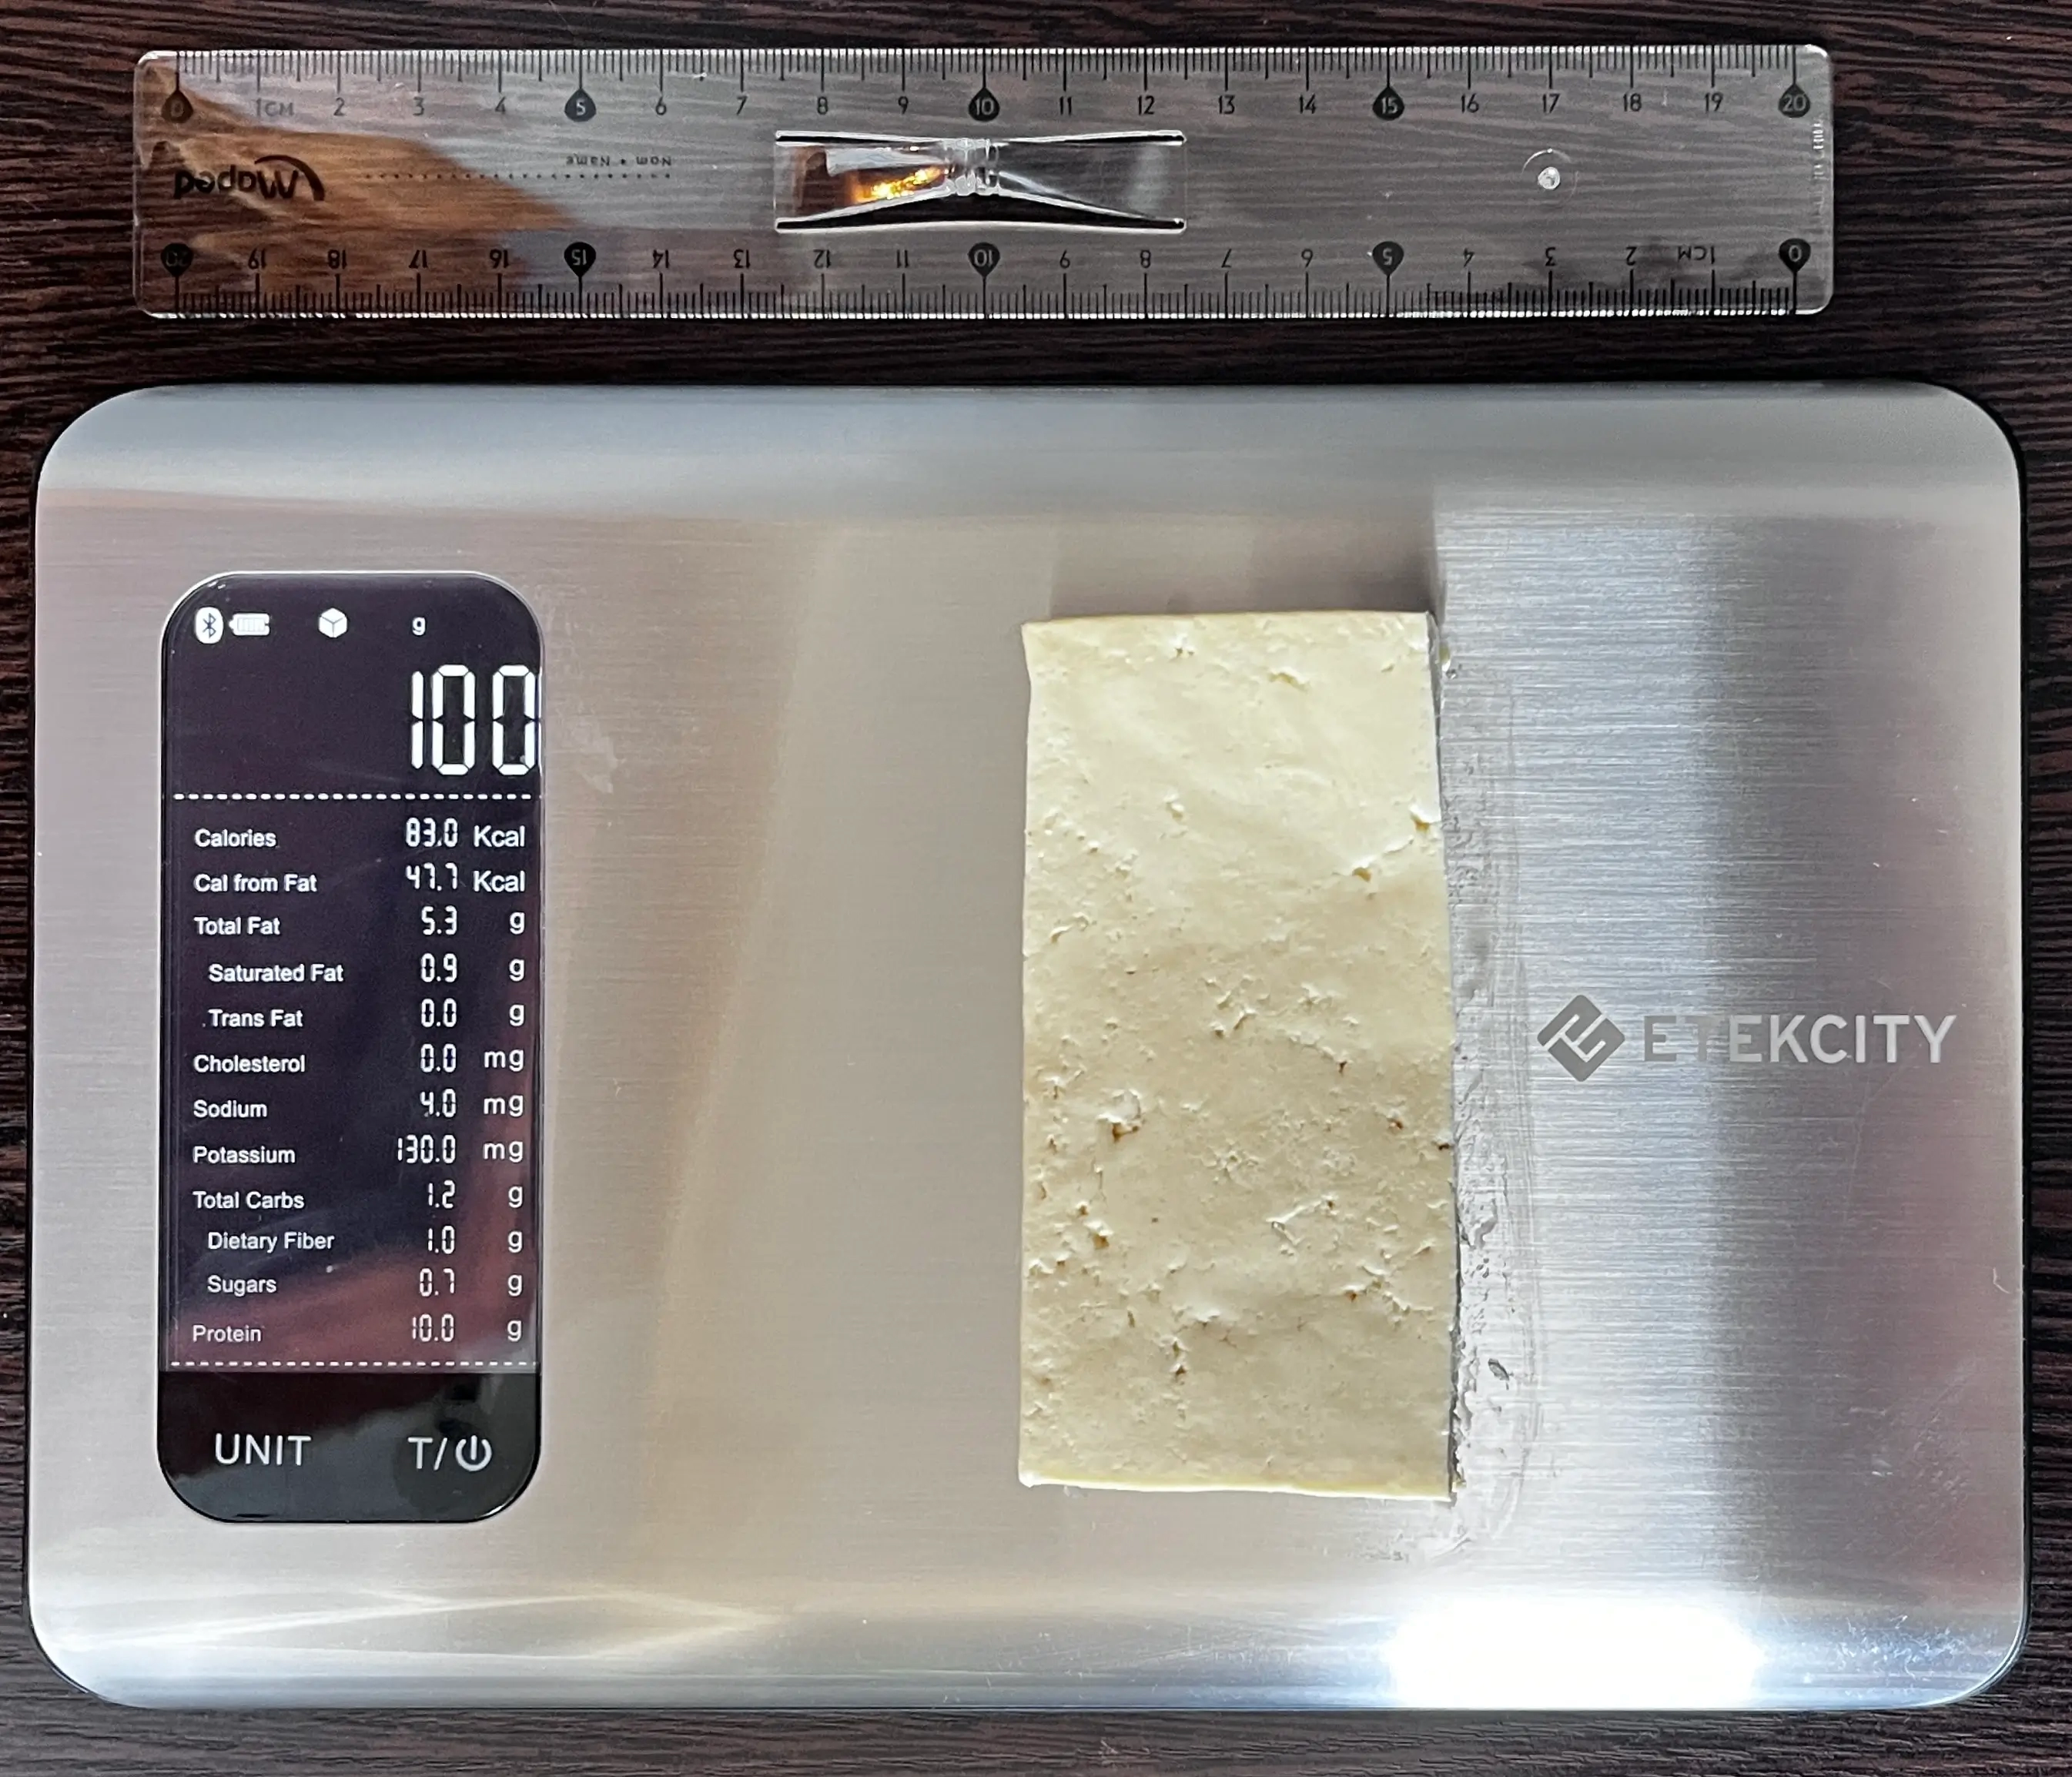
What Do 83 Calories or 100 Grams of Tofu Look Like?
The picture below shows what 83 calories or 100 grams of raw, firm tofu (prepared with calcium sulfate) look like, giving a visual reference for its weight and energy content. A typical serving size is 0.5 cup (126 g), which provides 105 calories. Keep in mind that calorie content may vary depending on the type of tofu and preparation method.

Education: General Medicine at YSMU
Last updated: August 22, 2024
Medically reviewed by Jack Yacoubian
Top nutrition facts for Tofu
| Calories ⓘ Calories for selected serving | 144 kcal |
|
Glycemic index ⓘ
Source: Check out our full article on Tofu glycemic index https://www.sciencedirect.com/science/article/pii/S0002916522004944Check out our Glycemic index chart page for the full list.
|
15 (low) |
| Glycemic load ⓘ Glycemic Load (GL) is a metric that measures both the quality (Glycemic Index) and quantity of carbohydrates in a specific serving of food to estimate its impact on blood sugar levels. It is calculated as: (GI × Carbs in grams) / 100. | 0 (low) |
| Insulin index ⓘ The insulin index of foods demonstrates how much a food increases the insulin level in the blood, in the first two-hour period after consumption. | 21 ⓘ https://ses.library.usyd.edu.au/handle/2123/11945 |
| Net carbs ⓘ Net Carbs = Total Carbohydrates – Fiber – Sugar Alcohols | 0 g |
| Default serving size ⓘ Serving sizes are mostly taken from FDA's Reference Amounts Customarily Consumed (RACCs) | 0.5 cup (126 g) |
| Acidity (Based on PRAL) ⓘ PRAL (Potential renal acid load) is calculated using a formula. On the PRAL scale the higher the positive value, the more is the acidifying effect on the body. The lower the negative value, the higher the alkalinity of the food. 0 is neutral. | 0.1 (neutral) |
| Oxalates | 6 mg ⓘ https://core.ac.uk/reader/38935472?utm_source=linkout |
Tofu calories (kcal)
| Calories for different serving sizes of tofu | Calories | Weight |
|---|---|---|
| Calories in 100 grams | 144 | |
| Calories in 0.25 block | 117 | 81 g |
| Calories in 0.5 cup | 181 | 126 g |
| Calories for different varieties of tofu | Calories | Weight |
|---|---|---|
| Tofu, raw, firm, prepared with calcium sulfate (this food) | 144 | 100 g |
| Tofu, soft, prepared with calcium sulfate and magnesium chloride (nigari) | 61 | 100 g |
| Tofu | 76 | 100 g |
| Tofu, firm, prepared with calcium sulfate and magnesium chloride (nigari) | 78 | 100 g |
| Tofu, extra firm, prepared with nigari | 83 | 100 g |
| Tofu, salted and fermented (fuyu) | 116 | 100 g |
| Tofu, salted and fermented (fuyu), prepared with calcium sulfate | 116 | 100 g |
| Tofu, hard, prepared with nigari | 145 | 100 g |
| Tofu, fried | 270 | 100 g |
| Tofu, fried, prepared with calcium sulfate | 270 | 100 g |
| Tofu, dried-frozen (koyadofu), prepared with calcium sulfate | 470 | 100 g |
| Tofu, dried-frozen (koyadofu) | 477 | 100 g |
Extra Nutrition facts for Tofu
| Protein per 100 calories ⓘ Shows how many grams of protein you get from 100 calories of this food, calculated as (protein in g ÷ calories) × 100. | 12 g |
| Calories per 10 g protein ⓘ Shows how many calories you need to eat from this food to get 10 g of protein, calculated as (calories ÷ protein in g) × 10. | 83 kcal |
| Weight per 100 calories ⓘ Shows how many grams of this food equal 100 kcal—higher grams mean a larger portion for the same calories. | 69 g |
| Unsaturated / Saturated Fat ratio ⓘ (monounsaturated + polyunsaturated) / saturated, ≥2 broadly recommended by major guidelines for heart health | 5.4 |
Tofu Glycemic index (GI)
Source:
Check out our full article on Tofu glycemic index
https://www.sciencedirect.com/science/article/pii/S0002916522004944Check out our Glycemic index chart page for the full list.
Mineral coverage chart
Mineral chart - relative view
Vitamin coverage chart
Vitamin A:
0µg of 900µg
0%
Vitamin E:
0mg of 15mg
0%
Vitamin D:
0µg of 20µg
0%
Vitamin C:
0.6mg of 90mg
0.67%
Vitamin B1:
0.47mg of 1mg
40%
Vitamin B2:
0.31mg of 1mg
24%
Vitamin B3:
1.1mg of 16mg
7.1%
Vitamin B5:
0.4mg of 5mg
8%
Vitamin B6:
0.28mg of 1mg
21%
Folate:
87µg of 400µg
22%
Vitamin B12:
0µg of 2µg
0%
Vitamin K:
0µg of 120µg
0%
Vitamin chart - relative view
Macronutrients chart
Protein:
Daily Value: 35%
17.3 g of 50 g
17.3 g (35% of DV )
Fats:
Daily Value: 13%
8.7 g of 65 g
8.7 g (13% of DV )
Carbs:
Daily Value: 1%
2.8 g of 300 g
2.8 g (1% of DV )
Water:
Daily Value: 3%
69.8 g of 2,000 g
69.8 g (3% of DV )
Other:
1.4 g
1.4 g
Protein quality breakdown
Tryptophan:
705mg of 280mg
252%
Threonine:
2355mg of 1,050mg
224%
Isoleucine:
2547mg of 1,400mg
182%
Leucine:
4176mg of 2,730mg
153%
Lysine:
2649mg of 2,100mg
126%
Methionine:
633mg of 1,050mg
60%
Phenylalanine:
2505mg of 1,750mg
143%
Valine:
2610mg of 1,820mg
143%
Histidine:
1293mg of 700mg
185%
Fat type information
Saturated fat:
1.3 g
Monounsaturated fat:
1.9 g
Polyunsaturated fat:
4.9 g
Fiber content ratio for Tofu
Sugar:
0 g
Fiber:
2.3 g
Other:
0.48 g
All nutrients for Tofu per 100g
| Nutrient | Value | DV% | In TOP % of foods | Comparison |
| Calories | 144kcal | 7% | 62% |
3.1 times more than Orange
|
| Protein per 100 calories | 12g | N/A | 21% | |
| Calories per 10 g protein | 83kcal | N/A | 76% | |
| Weight per 100 calories | 69g | N/A | 39% | |
| Protein | 17g | 41% | 31% |
6.1 times more than Broccoli
|
| Fats | 8.7g | 13% | 38% |
3.8 times less than Cheese
|
| Unsaturated / Saturated Fat ratio | 5.4 | N/A | 8% | |
| Vitamin C | 0.2mg | 0% | 43% |
265 times less than Lemon
|
| Carbs | 2.8g | 1% | 67% |
10.1 times less than Rice
|
| Net carbs | 0.48g | N/A | 72% |
112.9 times less than Chocolate
|
| Cholesterol | 0mg | 0% | 100% |
N/A
|
| Vitamin D | 0µg | 0% | 100% |
N/A
|
| Vitamin D* | 0 IU | 0% | 100% |
N/A
|
| Magnesium | 58mg | 14% | 12% |
2.4 times less than Almonds
|
| Calcium | 683mg | 68% | 2% |
5.5 times more than Milk
|
| Potassium | 237mg | 7% | 47% |
1.6 times more than Cucumber
|
| Iron | 2.7mg | 33% | 24% |
Equal to Beef broiled
|
| Fiber | 2.3g | 9% | 27% |
Equal to Orange
|
| Copper | 0.38mg | 42% | 9% |
2.7 times more than Shiitake
|
| Zinc | 1.6mg | 14% | 37% |
4 times less than Beef broiled
|
| Phosphorus | 190mg | 27% | 35% |
Equal to Chicken meat
|
| Sodium | 14mg | 1% | 83% |
35 times less than White bread
|
| Manganese | 1.2mg | 51% | 7% | |
| Selenium | 17µg | 32% | 31% | |
| Vitamin B1 | 0.16mg | 13% | 32% |
1.7 times less than Pea raw
|
| Vitamin B2 | 0.1mg | 8% | 61% |
1.3 times less than Avocado
|
| Vitamin B3 | 0.38mg | 2% | 75% |
25.1 times less than Turkey meat
|
| Vitamin B5 | 0.13mg | 3% | 61% |
8.5 times less than Sunflower seeds
|
| Vitamin B6 | 0.09mg | 7% | 57% |
1.3 times less than Oats
|
| Vitamin B12 | 0µg | 0% | 100% |
N/A
|
| Trans fat | 0g | N/A | 100% |
N/A
|
| Folate | 29µg | 7% | 29% |
2.1 times less than Brussels sprouts
|
| Saturated fat | 1.3g | 6% | 53% |
4.7 times less than Beef broiled
|
| Monounsaturated fat | 1.9g | N/A | 47% |
5.1 times less than Avocado
|
| Polyunsaturated fat | 4.9g | N/A | 11% |
9.6 times less than Walnut
|
| Tryptophan | 0.24mg | 0% | 18% |
1.3 times less than Chicken meat
|
| Threonine | 0.79mg | 0% | 25% |
1.1 times more than Beef broiled
|
| Isoleucine | 0.85mg | 0% | 24% |
1.1 times less than Salmon raw
|
| Leucine | 1.4mg | 0% | 27% |
1.7 times less than Tuna Bluefin
|
| Lysine | 0.88mg | 0% | 31% |
2 times more than Tofu
|
| Methionine | 0.21mg | 0% | 34% |
2.2 times more than Quinoa
|
| Phenylalanine | 0.84mg | 0% | 21% |
1.3 times more than Egg
|
| Valine | 0.87mg | 0% | 27% |
2.3 times less than Soybean raw
|
| Histidine | 0.43mg | 0% | 30% |
1.7 times less than Turkey meat
|
Check out similar food or compare with current
NUTRITION FACTS LABEL
Nutrition Facts
___servings per container
Serving Size ______________
Serving Size ______________
Amount Per 100g
Calories 144
% Daily Value*
13%
Total Fat
8.7g
5.7%
Saturated Fat 1.3g
0
Trans Fat
0g
0
Cholesterol 0mg
0.61%
Sodium 14mg
0.93%
Total Carbohydrate
2.8g
9.2%
Dietary Fiber
2.3g
Total Sugars 0g
Includes ? g Added Sugars
Protein
17g
Vitamin D
0mcg
0
Calcium
683mg
68%
Iron
2.7mg
33%
Potassium
237mg
7%
*
The % Daily Value (DV) tells you how much a nutrient in a serving of food contributes to a daily diet. 2,000 calories a day is used for general nutrition advice.
Health checks
ⓘ
Dietary cholesterol is not associated with an increased risk of coronary heart disease in healthy individuals. However, dietary cholesterol is common in foods that are high in harmful saturated fats.
Source
Low in Cholesterol
ⓘ
Trans fat consumption increases the risk of cardiovascular disease and mortality by negatively affecting blood lipid levels.
Source
No Trans Fats
ⓘ
Saturated fat intake can raise total cholesterol and LDL (low-density lipoprotein) levels, leading to an increased risk of atherosclerosis. Dietary guidelines recommend limiting saturated fats to under 10% of calories a day.
Source
Low in Saturated Fats
ⓘ
While the consumption of moderate amounts of added sugars is not detrimental to health, an excessive intake can increase the risk of obesity, and therefore, diabetes.
Source
Low in Sugars
Tofu nutrition infographic
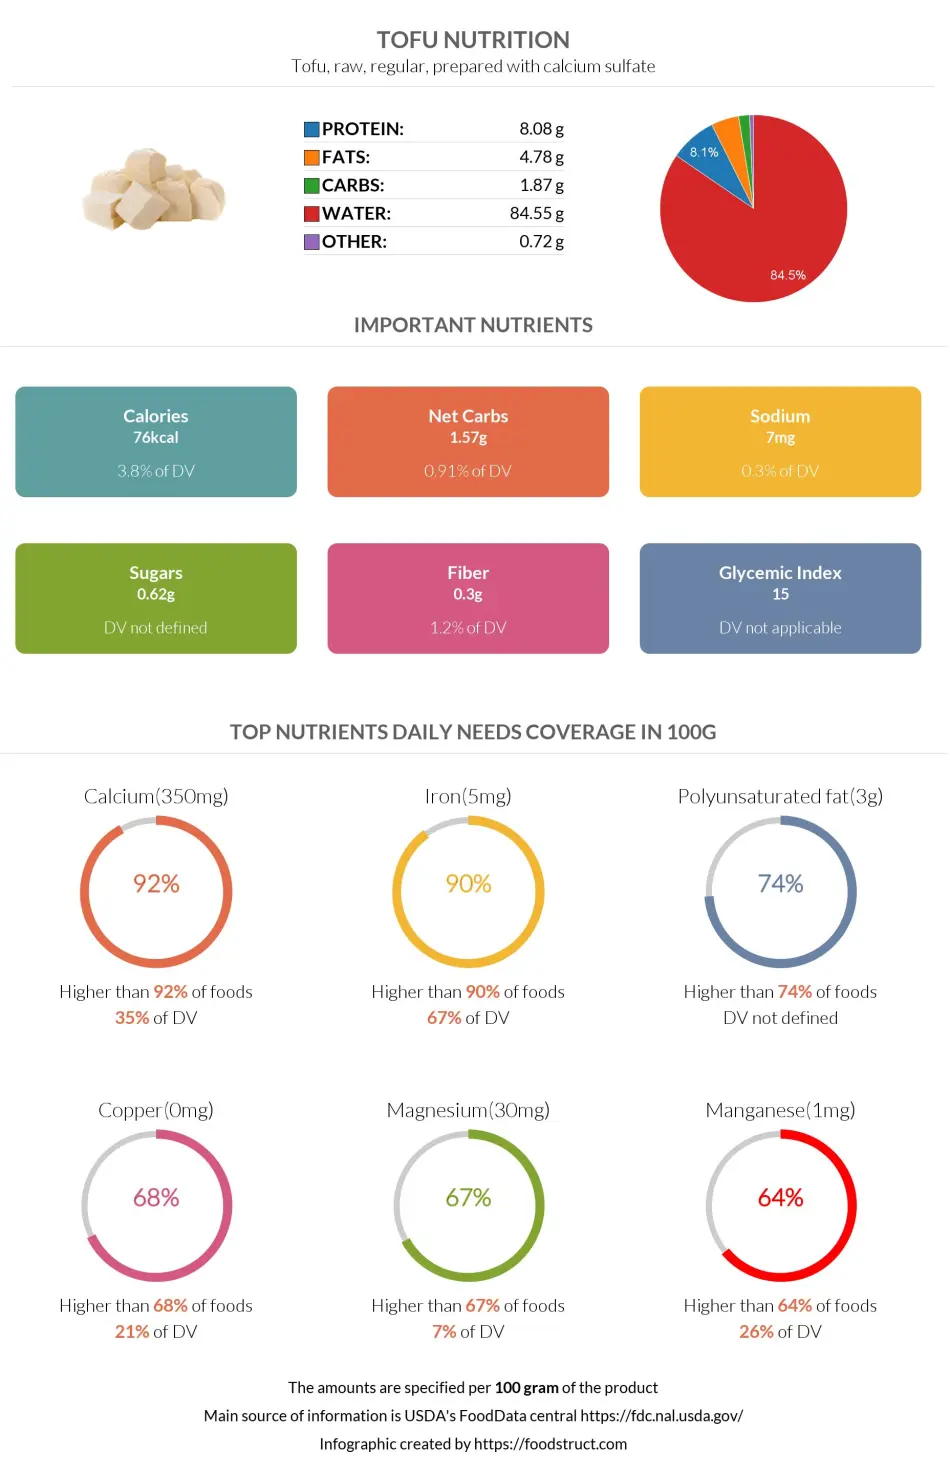
Infographic link
References
All the values for which the sources are not specified explicitly are taken from FDA’s Food Central. The exact link to the food presented on this page can be found below.