Crackers, gluten-free, multigrain and vegetable, made with corn starch and white rice flour vs. Melba toast — In-Depth Nutrition Comparison
Compare
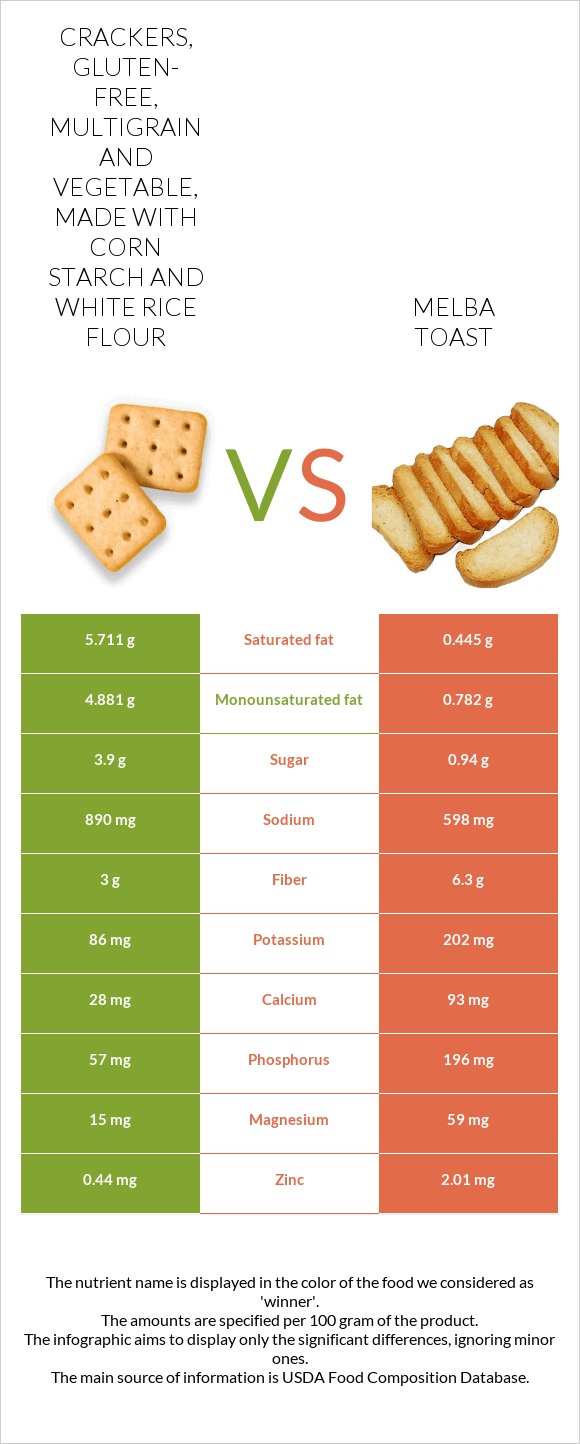
The main differences between crackers, gluten-free, multigrain and vegetable, made with corn starch and white rice flour and melba toast
- Crackers, gluten-free, multigrain, and vegetable, made with corn starch and white rice flour contains less iron, manganese, vitamin B1, folate, copper, vitamin B3, phosphorus, zinc, and vitamin B2 than melba toast.
- Daily need coverage for iron for melba toast is 39% higher.
- Melba toast has 13 times less saturated fat than crackers, gluten-free, multigrain, and vegetable, made with corn starch and white rice flour. Crackers, gluten-free, multigrain, and vegetable, made with corn starch and white rice flour has 5.711g of saturated fat, while melba toast has 0.445g.
Food types used in this article are Crackers, gluten-free, multigrain, and vegetable, made with corn starch and white rice flour and Crackers, melba toast, plain.
Infographic
Infographic link
Mineral Comparison
Mineral comparison score is based on the number of minerals by which one or the other food is richer. The "coverage" charts below show how much of the daily needs can be covered by 300 grams of the food.
| Contains more MagnesiumMagnesium | +293.3% |
| Contains more CalciumCalcium | +232.1% |
| Contains more PotassiumPotassium | +134.9% |
| Contains more IronIron | +560.7% |
| Contains more CopperCopper | +232.2% |
| Contains more ZincZinc | +356.8% |
| Contains more PhosphorusPhosphorus | +243.9% |
| Contains less SodiumSodium | -32.8% |
| Contains more ManganeseManganese | +277.9% |
Vitamin Comparison
Vitamin comparison score is based on the number of vitamins by which one or the other food is richer. The "coverage" charts below show how much of the daily needs can be covered by 300 grams of the food.
| Contains more Vitamin B1Vitamin B1 | +588.3% |
| Contains more Vitamin B2Vitamin B2 | +173% |
| Contains more Vitamin B3Vitamin B3 | +552.9% |
| Contains more Vitamin B6Vitamin B6 | +40% |
| Contains more FolateFolate | +1671.4% |
All nutrients comparison - raw data values
| Nutrient |  |
 |
DV% diff. |
| Selenium | 34.8µg | 63% | |
| Iron | 0.56mg | 3.7mg | 39% |
| Manganese | 0.299mg | 1.13mg | 36% |
| Starch | 71.9g | 30% | |
| Vitamin B1 | 0.06mg | 0.413mg | 29% |
| Folate | 7µg | 124µg | 29% |
| Saturated fat | 5.711g | 0.445g | 24% |
| Copper | 0.087mg | 0.289mg | 22% |
| Vitamin B3 | 0.63mg | 4.113mg | 22% |
| Phosphorus | 57mg | 196mg | 20% |
| Protein | 2.5g | 12.1g | 19% |
| Fats | 15.41g | 3.2g | 19% |
| Zinc | 0.44mg | 2.01mg | 14% |
| Vitamin B5 | 0.693mg | 14% | |
| Fiber | 3g | 6.3g | 13% |
| Sodium | 890mg | 598mg | 13% |
| Vitamin B2 | 0.1mg | 0.273mg | 13% |
| Magnesium | 15mg | 59mg | 10% |
| Monounsaturated fat | 4.881g | 0.782g | 10% |
| Calcium | 28mg | 93mg | 7% |
| Choline | 19.8mg | 4% | |
| Calories | 456kcal | 390kcal | 3% |
| Potassium | 86mg | 202mg | 3% |
| Vitamin E | 0.43mg | 3% | |
| Vitamin B6 | 0.07mg | 0.098mg | 2% |
| Vitamin K | 0.9µg | 1% | |
| Polyunsaturated fat | 1.374g | 1.282g | 1% |
| Protein per 100 calories | 0.55g | 3.1g | N/A |
| Calories per 10 g protein | 1824kcal | 322kcal | N/A |
| Weight per 100 calories | 22g | 26g | N/A |
| Unsaturated / Saturated Fat ratio | 1.1 | 4.6 | N/A |
| Net carbs | 73.94g | 70.3g | N/A |
| Carbs | 76.94g | 76.6g | 0% |
| Sugar | 3.9g | 0.94g | N/A |
| Trans fat | 0.048g | N/A | |
| Tryptophan | 0.14mg | 0% | |
| Threonine | 0.342mg | 0% | |
| Isoleucine | 0.462mg | 0% | |
| Leucine | 0.844mg | 0% | |
| Lysine | 0.28mg | 0% | |
| Methionine | 0.214mg | 0% | |
| Phenylalanine | 0.596mg | 0% | |
| Valine | 0.52mg | 0% | |
| Histidine | 0.261mg | 0% | |
| Fructose | 0.3g | 0% | |
| Omega-3 - EPA | 0.004g | 0g | N/A |
| Omega-3 - ALA | 0.027g | N/A | |
| Omega-3 - Eicosatrienoic acid | 0.001g | N/A | |
| Omega-6 - Gamma-linoleic acid | 0.007g | N/A | |
| Omega-6 - Dihomo-gamma-linoleic acid | 0.001g | N/A | |
| Omega-6 - Linoleic acid | 1.292g | N/A |
Macronutrient Comparison
Macronutrient breakdown side-by-side comparison
Protein:
2.5 g
Fats:
15.41 g
Carbs:
76.94 g
Water:
2.48 g
Other:
2.67 g
Protein:
12.1 g
Fats:
3.2 g
Carbs:
76.6 g
Water:
5.1 g
Other:
3 g
| Contains more FatsFats | +381.6% |
| Contains more ProteinProtein | +384% |
| Contains more WaterWater | +105.6% |
| Contains more OtherOther | +12.4% |
~equal in
Carbs
~76.6g
Fat Type Comparison
Fat type breakdown side-by-side comparison
Saturated fat:
Sat. Fat
5.711 g
Monounsaturated fat:
Mono. Fat
4.881 g
Polyunsaturated fat:
Poly. Fat
1.374 g
Saturated fat:
Sat. Fat
0.445 g
Monounsaturated fat:
Mono. Fat
0.782 g
Polyunsaturated fat:
Poly. Fat
1.282 g
| Contains more Mono. FatMonounsaturated fat | +524.2% |
| Contains less Sat. FatSaturated fat | -92.2% |
~equal in
Polyunsaturated fat
~1.282g