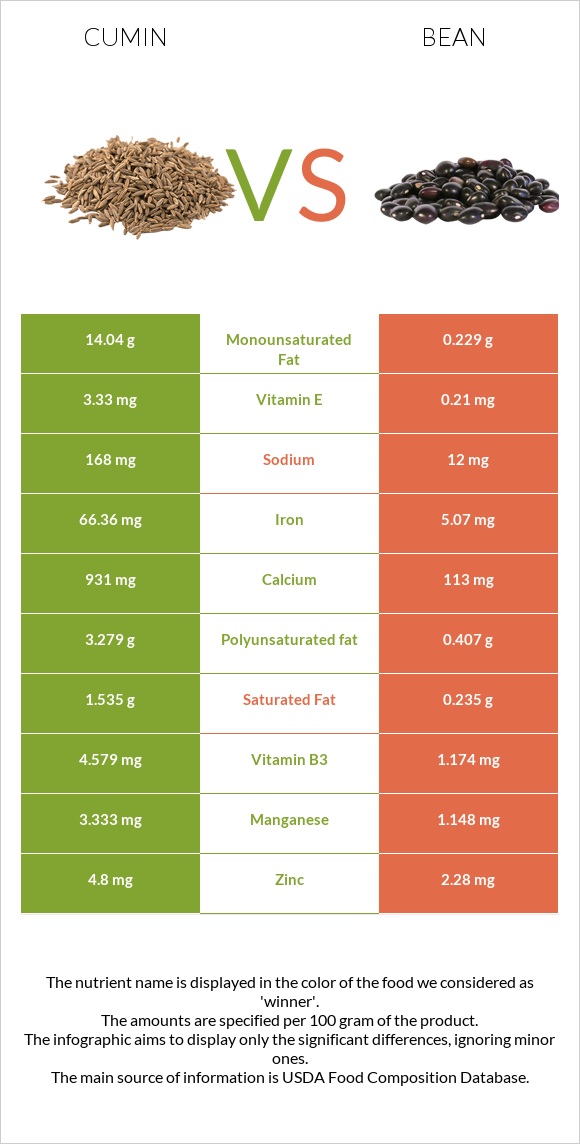
Summary of differences between cumin and beans Beans have less iron, calcium, magnesium, copper, phosphorus, potassium, vitamin B1, zinc, vitamin B3, and vitamin B6 than cumin. Cumin covers your daily need for iron, 826% more than beans. Cumin has 19 times more calcium than beans. While cumin has 931mg of calcium, beans have only 50mg. The glycemic index of beans is higher. These are the specific foods used in this comparison Spices, cumin seed and Beans, baked, canned, no salt added .
Infographic
Mineral Comparison
Mineral comparison score is based on the number of minerals by which one or the other food is richer. The "coverage" charts below show how much of the daily needs can be covered by 300 grams of the food.
9
100 g
300 g
0.25 tsp, whole - 0.5g 1 tbsp, whole - 6g
Magnesium
Magnesium
Calcium
Calcium
Potassium
Potassium
Iron
Iron
Copper
Copper
Zinc
Zinc
Phosphorus
Phosphorus
Sodium
Sodium
Manganese
Manganese
Selenium
Selenium
261%
279%
158%
2489%
289%
131%
214%
22%
435%
28%
1
100 g
300 g
1 cup - 253g
Magnesium
Magnesium
Calcium
Calcium
Potassium
Potassium
Iron
Iron
Copper
Copper
Zinc
Zinc
Phosphorus
Phosphorus
Sodium
Sodium
Manganese
Manganese
Selenium
Selenium
23%
15%
26%
11%
69%
38%
45%
0.13%
0%
25%
Vitamin Comparison
Vitamin comparison score is based on the number of vitamins by which one or the other food is richer. The "coverage" charts below show how much of the daily needs can be covered by 300 grams of the food.
8
100 g
300 g
0.25 tsp, whole - 0.5g 1 tbsp, whole - 6g
Vitamin C
Vit. C
Vitamin D
Vit. D
Vitamin A
Vit. A
Vitamin E
Vit. E
Vitamin B1
Vit. B1
Vitamin B2
Vit. B2
Vitamin B3
Vit. B3
Vitamin B5
Vit. B5
Vitamin B6
Vit. B6
Vitamin B12
Vit. B12
Vitamin K
Vit. K
Folate
Folate
26%
0%
21%
67%
157%
75%
86%
0%
100%
0%
14%
7.5%
1
100 g
300 g
1 cup - 253g
Vitamin C
Vit. C
Vitamin D
Vit. D
Vitamin A
Vit. A
Vitamin E
Vit. E
Vitamin B1
Vit. B1
Vitamin B2
Vit. B2
Vitamin B3
Vit. B3
Vitamin B5
Vit. B5
Vitamin B6
Vit. B6
Vitamin B12
Vit. B12
Vitamin K
Vit. K
Folate
Folate
10%
0%
1.7%
3%
38%
14%
8.1%
0%
30%
0%
2%
18%
All nutrients comparison - raw data values
Nutrient
DV% diff.
Iron
66.36mg
0.29mg
826%
Manganese
3.333mg
145%
Calcium
931mg
50mg
88%
Magnesium
366mg
32mg
80%
Copper
0.867mg
0.206mg
73%
Phosphorus
499mg
104mg
56%
Potassium
1788mg
296mg
44%
Vitamin B1
0.628mg
0.15mg
40%
Monounsaturated fat
14.04g
0.035g
35%
Fats
22.27g
0.4g
34%
Zinc
4.8mg
1.4mg
31%
Protein
17.81g
4.8g
26%
Vitamin B3
4.579mg
0.43mg
26%
Vitamin B6
0.435mg
0.13mg
23%
Vitamin E
3.33mg
0.15mg
21%
Vitamin B2
0.327mg
0.06mg
21%
Polyunsaturated fat
3.279g
0.172g
21%
Fiber
10.5g
5.5g
20%
Calories
375kcal
105kcal
14%
Carbs
44.24g
20.49g
8%
Sodium
168mg
1mg
7%
Vitamin A
64µg
5µg
7%
Saturated fat
1.535g
0.103g
7%
Vitamin C
7.7mg
3.1mg
5%
Vitamin K
5.4µg
0.8µg
4%
Folate
10µg
24µg
4%
Selenium
5.2µg
4.5µg
1%
Choline
24.7mg
30.8mg
1%
Protein per 100 calories
4.7g
4.6g
N/A
Calories per 10 g protein
211kcal
219kcal
N/A
Weight per 100 calories
27g
95g
N/A
Unsaturated / Saturated Fat ratio
11
2
N/A
Net carbs
33.74g
14.99g
N/A
Sugar
2.25g
7.78g
N/A
Macronutrient Comparison
Macronutrient breakdown side-by-side comparison
4
18%
22%
44%
8%
8%
Protein:
17.81 g
Fats:
22.27 g
Carbs:
44.24 g
Water:
8.06 g
Other:
7.62 g
1
5%
20%
73%
2%
Protein:
4.8 g
Fats:
0.4 g
Carbs:
20.49 g
Water:
72.6 g
Other:
1.71 g
Contains
more
Protein Protein
+271%
Contains
more
Fats Fats
+5467.5%
Contains
more
Carbs Carbs
+115.9%
Contains
more
Other Other
+345.6%
Contains
more
Water Water
+800.7%
Fat Type Comparison
Fat type breakdown side-by-side comparison
2
8%
74%
17%
Saturated fat:
Sat. Fat
1.535 g
Monounsaturated fat:
Mono. Fat
14.04 g
Polyunsaturated fat:
Poly. Fat
3.279 g
1
33%
11%
55%
Saturated fat:
Sat. Fat
0.103 g
Monounsaturated fat:
Mono. Fat
0.035 g
Polyunsaturated fat:
Poly. Fat
0.172 g
Contains
more
Mono. Fat Monounsaturated fat
+40014.3%
Contains
more
Poly. Fat Polyunsaturated fat
+1806.4%
Contains
less
Sat. Fat Saturated fat
-93.3%