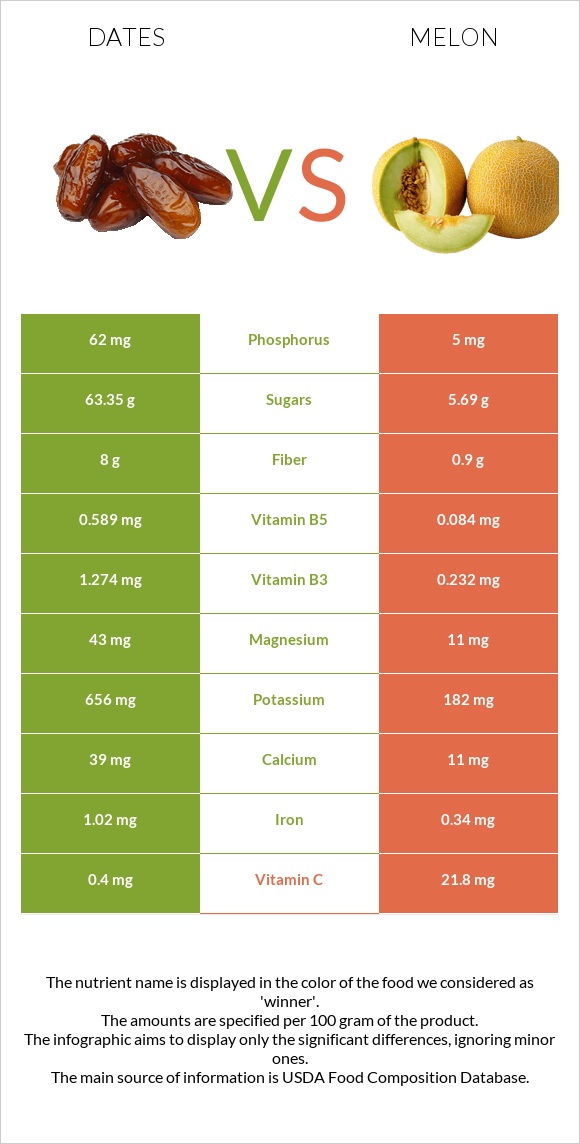
Significant differences between dates and melon Dates have more fiber, copper, potassium, vitamin B5, manganese, iron, phosphorus, magnesium, and vitamin B3; however, melon is richer in vitamin C. Dates cover your daily fiber needs 28% more than melon. Melon has 12 times less phosphorus than dates. Dates have 62mg of phosphorus, while melon has 5mg. Melon has a higher glycemic index. The glycemic index of melon is 62, while the glycemic index of dates is 42. Specific food types used in this comparison are Dates, deglet noor and Melons, casaba, raw .
Infographic
Mineral Comparison
Mineral comparison score is based on the number of minerals by which one or the other food is richer. The "coverage" charts below show how much of the daily needs can be covered by 300 grams of the food.
10
100 g
300 g
1 date, pitted - 7.1g 1 cup, chopped - 147g
Magnesium
Magnesium
Calcium
Calcium
Potassium
Potassium
Iron
Iron
Copper
Copper
Zinc
Zinc
Phosphorus
Phosphorus
Sodium
Sodium
Manganese
Manganese
Selenium
Selenium
31%
12%
58%
38%
69%
7.9%
27%
0.26%
34%
16%
0
100 g
300 g
0.1 fruit - 164g 1 cup, cubes - 170g 1 melon - 1640g
Magnesium
Magnesium
Calcium
Calcium
Potassium
Potassium
Iron
Iron
Copper
Copper
Zinc
Zinc
Phosphorus
Phosphorus
Sodium
Sodium
Manganese
Manganese
Selenium
Selenium
7.9%
3.3%
16%
13%
20%
1.9%
2.1%
1.2%
4.6%
2.2%
Vitamin Comparison
Vitamin comparison score is based on the number of vitamins by which one or the other food is richer. The "coverage" charts below show how much of the daily needs can be covered by 300 grams of the food.
5
100 g
300 g
1 date, pitted - 7.1g 1 cup, chopped - 147g
Vitamin C
Vit. C
Vitamin D
Vit. D
Vitamin A
Vit. A
Vitamin E
Vit. E
Vitamin B1
Vit. B1
Vitamin B2
Vit. B2
Vitamin B3
Vit. B3
Vitamin B5
Vit. B5
Vitamin B6
Vit. B6
Vitamin B12
Vit. B12
Vitamin K
Vit. K
Folate
Folate
1.3%
0%
0%
1%
13%
15%
24%
35%
38%
0%
6.8%
14%
1
100 g
300 g
0.1 fruit - 164g 1 cup, cubes - 170g 1 melon - 1640g
Vitamin C
Vit. C
Vitamin D
Vit. D
Vitamin A
Vit. A
Vitamin E
Vit. E
Vitamin B1
Vit. B1
Vitamin B2
Vit. B2
Vitamin B3
Vit. B3
Vitamin B5
Vit. B5
Vitamin B6
Vit. B6
Vitamin B12
Vit. B12
Vitamin K
Vit. K
Folate
Folate
73%
0%
0%
1%
3.8%
7.2%
4.4%
5%
38%
0%
6.3%
6%
All nutrients comparison - raw data values
Nutrient
DV% diff.
Fiber
8g
0.9g
28%
Vitamin C
0.4mg
21.8mg
24%
Fructose
19.56g
24%
Carbs
75.03g
6.58g
23%
Copper
0.206mg
0.06mg
16%
Potassium
656mg
182mg
14%
Calories
282kcal
28kcal
13%
Manganese
0.262mg
0.035mg
10%
Vitamin B5
0.589mg
0.084mg
10%
Iron
1.02mg
0.34mg
9%
Magnesium
43mg
11mg
8%
Phosphorus
62mg
5mg
8%
Vitamin B3
1.274mg
0.232mg
7%
Selenium
3µg
0.4µg
5%
Protein
2.45g
1.11g
3%
Calcium
39mg
11mg
3%
Vitamin B1
0.052mg
0.015mg
3%
Vitamin B2
0.066mg
0.031mg
3%
Folate
19µg
8µg
3%
Zinc
0.29mg
0.07mg
2%
Protein per 100 calories
0.87g
4g
N/A
Calories per 10 g protein
1151kcal
252kcal
N/A
Weight per 100 calories
35g
357g
N/A
Fats
0.39g
0.1g
0%
Net carbs
67.03g
5.68g
N/A
Sugar
63.35g
5.69g
N/A
Sodium
2mg
9mg
0%
Vitamin E
0.05mg
0.05mg
0%
Vitamin B6
0.165mg
0.163mg
0%
Vitamin K
2.7µg
2.5µg
0%
Choline
6.3mg
7.6mg
0%
Saturated fat
0.032g
0.025g
0%
Monounsaturated fat
0.036g
0.002g
0%
Polyunsaturated fat
0.019g
0.039g
0%
Tryptophan
0.012mg
0%
Threonine
0.043mg
0%
Isoleucine
0.049mg
0%
Leucine
0.084mg
0%
Lysine
0.066mg
0%
Methionine
0.022mg
0%
Phenylalanine
0.05mg
0%
Valine
0.071mg
0%
Histidine
0.032mg
0%
Macronutrient Comparison
Macronutrient breakdown side-by-side comparison
4
2%
75%
21%
Protein:
2.45 g
Fats:
0.39 g
Carbs:
75.03 g
Water:
20.53 g
Other:
1.6 g
1
7%
92%
Protein:
1.11 g
Fats:
0.1 g
Carbs:
6.58 g
Water:
91.85 g
Other:
0.36 g
Contains
more
Protein Protein
+120.7%
Contains
more
Fats Fats
+290%
Contains
more
Carbs Carbs
+1040.3%
Contains
more
Other Other
+344.4%
Contains
more
Water Water
+347.4%
Fat Type Comparison
Fat type breakdown side-by-side comparison
1
37%
41%
22%
Saturated fat:
Sat. Fat
0.032 g
Monounsaturated fat:
Mono. Fat
0.036 g
Polyunsaturated fat:
Poly. Fat
0.019 g
2
38%
3%
59%
Saturated fat:
Sat. Fat
0.025 g
Monounsaturated fat:
Mono. Fat
0.002 g
Polyunsaturated fat:
Poly. Fat
0.039 g
Contains
more
Mono. Fat Monounsaturated fat
+1700%
Contains
less
Sat. Fat Saturated fat
-21.9%
Contains
more
Poly. Fat Polyunsaturated fat
+105.3%