Edamame unprepared vs. Chickpeas — In-Depth Nutrition Comparison
Compare
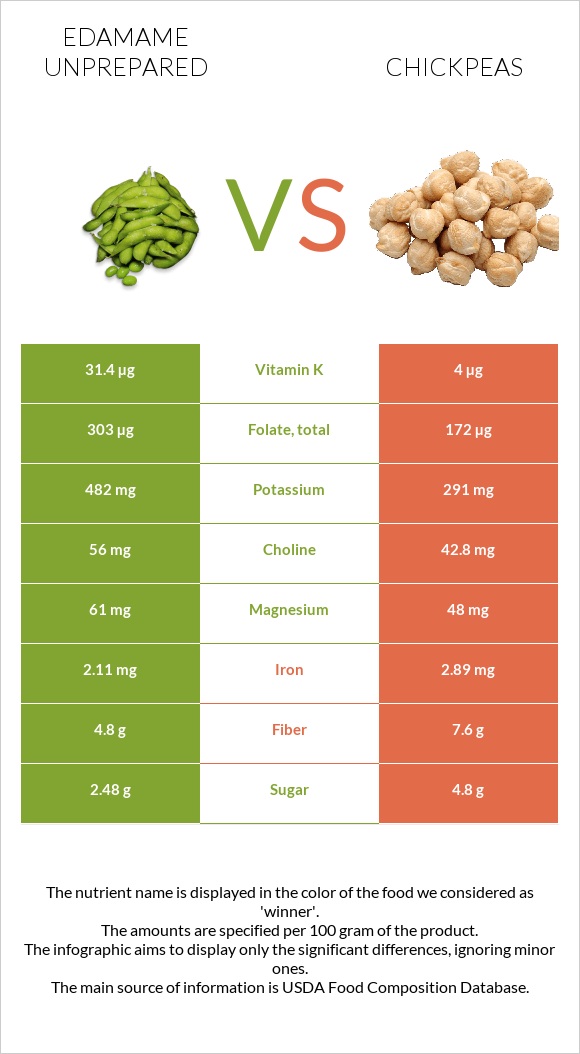
How are edamame unprepared and chickpeas different?
- Edamame unprepared is richer in folate, vitamin K, vitamin B2, vitamin C, and potassium, while chickpeas are higher in fiber and iron.
- Edamame unprepared covers your daily need for folate, 33% more than chickpeas.
- Edamame unprepared contains 8 times more vitamin K than chickpeas. Edamame unprepared contains 31.4µg of vitamin K, while chickpeas contain 4µg.
- Edamame unprepared is lower in sugar.
Edamame, frozen, unprepared and Chickpeas (garbanzo beans, bengal gram), mature seeds, cooked, boiled, without salt types were used in this article.
Infographic
Infographic link
Mineral Comparison
Mineral comparison score is based on the number of minerals by which one or the other food is richer. The "coverage" charts below show how much of the daily needs can be covered by 300 grams of the food.
| Contains more MagnesiumMagnesium | +27.1% |
| Contains more CalciumCalcium | +22.4% |
| Contains more PotassiumPotassium | +65.6% |
| Contains less SodiumSodium | -14.3% |
Vitamin Comparison
Vitamin comparison score is based on the number of vitamins by which one or the other food is richer. The "coverage" charts below show how much of the daily needs can be covered by 300 grams of the food.
| Contains more Vitamin CVitamin C | +646.2% |
| Contains more Vitamin EVitamin E | +105.7% |
| Contains more Vitamin B1Vitamin B1 | +29.3% |
| Contains more Vitamin B2Vitamin B2 | +320.6% |
| Contains more Vitamin B3Vitamin B3 | +75.9% |
| Contains more Vitamin B5Vitamin B5 | +87.1% |
| Contains more Vitamin KVitamin K | +685% |
| Contains more FolateFolate | +76.2% |
| Contains more CholineCholine | +30.8% |
All nutrients comparison - raw data values
| Nutrient |  |
 |
DV% diff. |
| Folate | 303µg | 172µg | 33% |
| Vitamin K | 31.4µg | 4µg | 23% |
| Vitamin B2 | 0.265mg | 0.063mg | 16% |
| Fiber | 4.8g | 7.6g | 11% |
| Iron | 2.11mg | 2.89mg | 10% |
| Vitamin C | 9.7mg | 1.3mg | 9% |
| Polyunsaturated fat | 1.156g | 8% | |
| Selenium | 3.7µg | 7% | |
| Carbs | 7.61g | 27.42g | 7% |
| Potassium | 482mg | 291mg | 6% |
| Vitamin B5 | 0.535mg | 0.286mg | 5% |
| Protein | 11.22g | 8.86g | 5% |
| Calories | 109kcal | 164kcal | 3% |
| Vitamin B1 | 0.15mg | 0.116mg | 3% |
| Fats | 4.73g | 2.59g | 3% |
| Copper | 0.324mg | 0.352mg | 3% |
| Magnesium | 61mg | 48mg | 3% |
| Choline | 56mg | 42.8mg | 2% |
| Vitamin E | 0.72mg | 0.35mg | 2% |
| Zinc | 1.32mg | 1.53mg | 2% |
| Vitamin B3 | 0.925mg | 0.526mg | 2% |
| Phosphorus | 161mg | 168mg | 1% |
| Monounsaturated fat | 0.583g | 1% | |
| Manganese | 1.01mg | 1.03mg | 1% |
| Calcium | 60mg | 49mg | 1% |
| Saturated fat | 0.269g | 1% | |
| Net carbs | 2.81g | 19.82g | N/A |
| Sugar | 2.48g | 4.8g | N/A |
| Starch | 0.33g | 0% | |
| Sodium | 6mg | 7mg | 0% |
| Vitamin A | 1µg | 0% | |
| Vitamin B6 | 0.135mg | 0.139mg | 0% |
| Tryptophan | 0.119mg | 0.085mg | 0% |
| Threonine | 0.312mg | 0.329mg | 0% |
| Isoleucine | 0.283mg | 0.38mg | 0% |
| Leucine | 0.702mg | 0.631mg | 0% |
| Lysine | 0.702mg | 0.593mg | 0% |
| Methionine | 0.133mg | 0.116mg | 0% |
| Phenylalanine | 0.46mg | 0.475mg | 0% |
| Valine | 0.305mg | 0.372mg | 0% |
| Histidine | 0.252mg | 0.244mg | 0% |
| Fructose | 0.21g | 0% |
Macronutrient Comparison
Macronutrient breakdown side-by-side comparison
Protein:
11.22 g
Fats:
4.73 g
Carbs:
7.61 g
Water:
75.17 g
Other:
1.27 g
Protein:
8.86 g
Fats:
2.59 g
Carbs:
27.42 g
Water:
60.21 g
Other:
0.92 g
| Contains more ProteinProtein | +26.6% |
| Contains more FatsFats | +82.6% |
| Contains more WaterWater | +24.8% |
| Contains more OtherOther | +38% |
| Contains more CarbsCarbs | +260.3% |