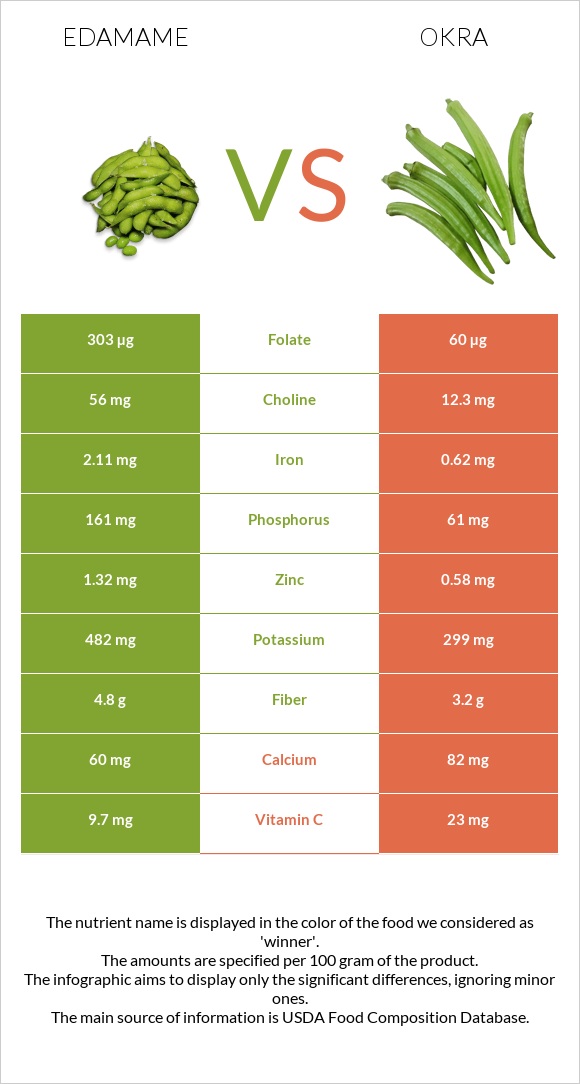
Significant differences between edamame and okra Edamame has more folate, copper, iron, phosphorus, manganese, choline, and fiber; however, okra is richer in vitamin C, vitamin B6, and vitamin A. Edamame covers your daily folate needs 63% more than okra. Okra has 5 times less choline than edamame. Edamame has 56.3mg of choline, while okra has 12.3mg. Specific food types used in this comparison are Edamame, frozen, prepared and Okra, raw .
Infographic
Mineral Comparison
Mineral comparison score is based on the number of minerals by which one or the other food is richer. The "coverage" charts below show how much of the daily needs can be covered by 300 grams of the food.
9
100 g
300 g
1 cup - 155g
Magnesium
Magnesium
Calcium
Calcium
Potassium
Potassium
Iron
Iron
Copper
Copper
Zinc
Zinc
Phosphorus
Phosphorus
Sodium
Sodium
Manganese
Manganese
Selenium
Selenium
46%
19%
38%
85%
115%
37%
72%
0.78%
134%
4.4%
1
100 g
300 g
8 pods (3" long) - 95g
Magnesium
Magnesium
Calcium
Calcium
Potassium
Potassium
Iron
Iron
Copper
Copper
Zinc
Zinc
Phosphorus
Phosphorus
Sodium
Sodium
Manganese
Manganese
Selenium
Selenium
41%
25%
26%
23%
36%
16%
26%
0.91%
103%
3.8%
Vitamin Comparison
Vitamin comparison score is based on the number of vitamins by which one or the other food is richer. The "coverage" charts below show how much of the daily needs can be covered by 300 grams of the food.
4
100 g
300 g
1 cup - 155g
Vitamin C
Vit. C
Vitamin D
Vit. D
Vitamin A
Vit. A
Vitamin E
Vit. E
Vitamin B1
Vit. B1
Vitamin B2
Vit. B2
Vitamin B3
Vit. B3
Vitamin B5
Vit. B5
Vitamin B6
Vit. B6
Vitamin B12
Vit. B12
Vitamin K
Vit. K
Folate
Folate
20%
0%
5%
14%
50%
36%
17%
24%
23%
0%
67%
233%
4
100 g
300 g
8 pods (3" long) - 95g
Vitamin C
Vit. C
Vitamin D
Vit. D
Vitamin A
Vit. A
Vitamin E
Vit. E
Vitamin B1
Vit. B1
Vitamin B2
Vit. B2
Vitamin B3
Vit. B3
Vitamin B5
Vit. B5
Vitamin B6
Vit. B6
Vitamin B12
Vit. B12
Vitamin K
Vit. K
Folate
Folate
77%
0%
12%
5.4%
50%
14%
19%
15%
50%
0%
78%
45%
All nutrients comparison - raw data values
Nutrient
DV% diff.
Folate
311µg
60µg
63%
Copper
0.345mg
0.109mg
26%
Iron
2.27mg
0.62mg
21%
Protein
11.91g
1.93g
20%
Vitamin C
6.1mg
23mg
19%
Phosphorus
169mg
61mg
15%
Polyunsaturated fat
2.156g
0.027g
14%
Manganese
1.024mg
0.788mg
10%
Vitamin B6
0.1mg
0.215mg
9%
Fats
5.2g
0.19g
8%
Fiber
5.2g
3.2g
8%
Choline
56.3mg
12.3mg
8%
Zinc
1.37mg
0.58mg
7%
Vitamin B2
0.155mg
0.06mg
7%
Calories
121kcal
33kcal
4%
Potassium
436mg
299mg
4%
Vitamin K
26.7µg
31.3µg
4%
Vitamin E
0.68mg
0.27mg
3%
Vitamin B5
0.395mg
0.245mg
3%
Saturated fat
0.62g
0.026g
3%
Monounsaturated fat
1.282g
0.017g
3%
Magnesium
64mg
57mg
2%
Calcium
63mg
82mg
2%
Vitamin A
15µg
36µg
2%
Vitamin B3
0.915mg
1mg
1%
Fructose
0.12g
0.57g
1%
Protein per 100 calories
9.8g
5.8g
N/A
Calories per 10 g protein
102kcal
171kcal
N/A
Weight per 100 calories
83g
303g
N/A
Unsaturated / Saturated Fat ratio
5.5
1.7
N/A
Net carbs
3.71g
4.25g
N/A
Carbs
8.91g
7.45g
0%
Sugar
2.18g
1.48g
N/A
Starch
1.51g
0.34g
0%
Sodium
6mg
7mg
0%
Selenium
0.8µg
0.7µg
0%
Vitamin B1
0.2mg
0.2mg
0%
Trans fat
0.009g
0g
N/A
Tryptophan
0.126mg
0.017mg
0%
Threonine
0.331mg
0.065mg
0%
Isoleucine
0.3mg
0.069mg
0%
Leucine
0.745mg
0.105mg
0%
Lysine
0.745mg
0.081mg
0%
Methionine
0.141mg
0.021mg
0%
Phenylalanine
0.488mg
0.065mg
0%
Valine
0.324mg
0.091mg
0%
Histidine
0.267mg
0.031mg
0%
Omega-3 - EPA
0.003g
0g
N/A
Omega-3 - ALA
0.358g
N/A
Omega-6 - Eicosadienoic acid
0.002g
N/A
Omega-6 - Linoleic acid
1.789g
N/A
Macronutrient Comparison
Macronutrient breakdown side-by-side comparison
4
12%
5%
9%
73%
Protein:
11.91 g
Fats:
5.2 g
Carbs:
8.91 g
Water:
72.77 g
Other:
1.21 g
1
2%
7%
90%
Protein:
1.93 g
Fats:
0.19 g
Carbs:
7.45 g
Water:
89.58 g
Other:
0.85 g
Contains
more
Protein Protein
+517.1%
Contains
more
Fats Fats
+2636.8%
Contains
more
Carbs Carbs
+19.6%
Contains
more
Other Other
+42.4%
Contains
more
Water Water
+23.1%
Fat Type Comparison
Fat type breakdown side-by-side comparison
2
15%
32%
53%
Saturated fat:
Sat. Fat
0.62 g
Monounsaturated fat:
Mono. Fat
1.282 g
Polyunsaturated fat:
Poly. Fat
2.156 g
1
37%
24%
39%
Saturated fat:
Sat. Fat
0.026 g
Monounsaturated fat:
Mono. Fat
0.017 g
Polyunsaturated fat:
Poly. Fat
0.027 g
Contains
more
Mono. Fat Monounsaturated fat
+7441.2%
Contains
more
Poly. Fat Polyunsaturated fat
+7885.2%
Contains
less
Sat. Fat Saturated fat
-95.8%
Carbohydrate type comparison
Carbohydrate type breakdown side-by-side comparison
3
41%
30%
3%
26%
Starch:
1.51 g
Sucrose:
1.12 g
Glucose:
0 g
Fructose:
0.12 g
Lactose:
0 g
Maltose:
0.95 g
Galactose:
0 g
2
19%
33%
17%
31%
Starch:
0.34 g
Sucrose:
0.6 g
Glucose:
0.32 g
Fructose:
0.57 g
Lactose:
0 g
Maltose:
0 g
Galactose:
0 g
Contains
more
Starch Starch
+344.1%
Contains
more
Sucrose Sucrose
+86.7%
Contains
more
Maltose Maltose
+∞%
Contains
more
Glucose Glucose
+∞%
Contains
more
Fructose Fructose
+375%
~equal in
Lactose
~0g
~equal in
Galactose
~0g