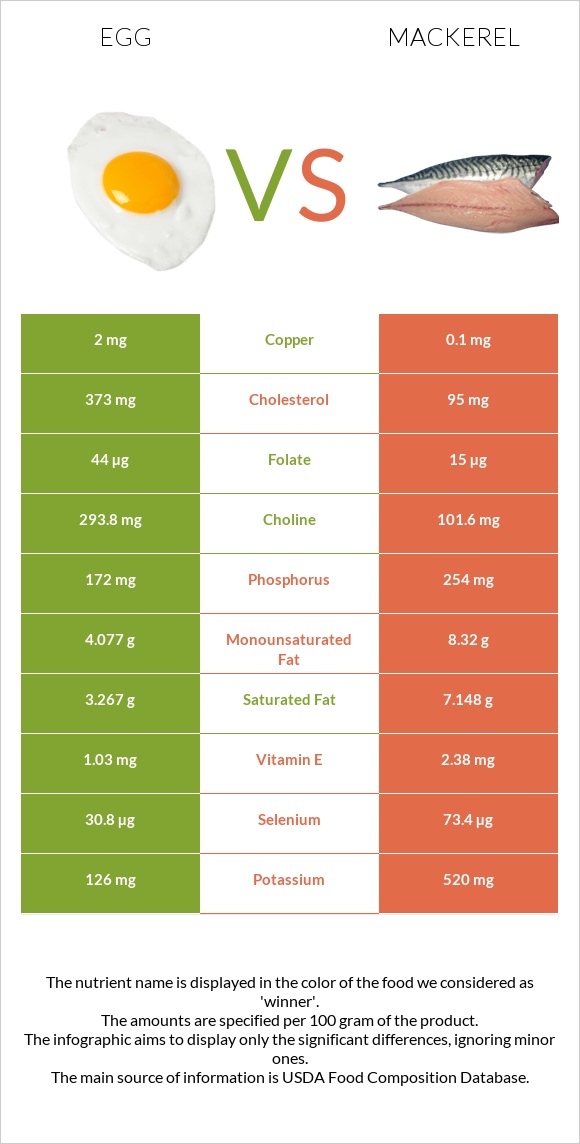
How are eggs and mackerel different? Eggs are higher in copper, choline, and vitamin B2; however, mackerel is richer in vitamin B12, vitamin D*, selenium, vitamin B6, and vitamin B3. Daily need coverage for vitamin B12 for mackerel is 454% higher. Eggs contain 20 times more copper than mackerel. While eggs contain 2mg of copper, mackerel contains only 0.1mg. Mackerel has less cholesterol. Egg, whole, cooked, hard-boiled and Fish, mackerel, salted are the varieties used in this article.
Infographic
Mineral Comparison
Mineral comparison score is based on the number of minerals by which one or the other food is richer. The "coverage" charts below show how much of the daily needs can be covered by 300 grams of the food.
3
100 g
300 g
1 tbsp - 8.5g 1 large - 50g 1 cup, chopped - 136g
Magnesium
Magnesium
Calcium
Calcium
Potassium
Potassium
Iron
Iron
Copper
Copper
Zinc
Zinc
Phosphorus
Phosphorus
Sodium
Sodium
Manganese
Manganese
Selenium
Selenium
7.1%
15%
11%
45%
667%
29%
74%
16%
3.4%
168%
6
100 g
300 g
1 cubic inch, boneless - 17g 1 piece (5-1/2" x 1-1/2" x 1/2") - 80g 1 cup, cooked - 136g
Magnesium
Magnesium
Calcium
Calcium
Potassium
Potassium
Iron
Iron
Copper
Copper
Zinc
Zinc
Phosphorus
Phosphorus
Sodium
Sodium
Manganese
Manganese
Selenium
Selenium
43%
20%
46%
53%
33%
30%
109%
580%
0%
400%
Vitamin Comparison
Vitamin comparison score is based on the number of vitamins by which one or the other food is richer. The "coverage" charts below show how much of the daily needs can be covered by 300 grams of the food.
5
100 g
300 g
1 tbsp - 8.5g 1 large - 50g 1 cup, chopped - 136g
Vitamin C
Vit. C
Vitamin D
Vit. D
Vitamin A
Vit. A
Vitamin E
Vit. E
Vitamin B1
Vit. B1
Vitamin B2
Vit. B2
Vitamin B3
Vit. B3
Vitamin B5
Vit. B5
Vitamin B6
Vit. B6
Vitamin B12
Vit. B12
Vitamin K
Vit. K
Folate
Folate
0%
33%
50%
21%
17%
118%
1.2%
84%
28%
139%
0.75%
33%
6
100 g
300 g
1 cubic inch, boneless - 17g 1 piece (5-1/2" x 1-1/2" x 1/2") - 80g 1 cup, cooked - 136g
Vitamin C
Vit. C
Vitamin D
Vit. D
Vitamin A
Vit. A
Vitamin E
Vit. E
Vitamin B1
Vit. B1
Vitamin B2
Vit. B2
Vitamin B3
Vit. B3
Vitamin B5
Vit. B5
Vitamin B6
Vit. B6
Vitamin B12
Vit. B12
Vitamin K
Vit. K
Folate
Folate
0%
378%
16%
48%
5%
44%
62%
0%
95%
1500%
20%
11%
All nutrients comparison - raw data values
Nutrient
DV% diff.
Vitamin B12
1.11µg
12µg
454%
Copper
2mg
0.1mg
211%
Sodium
124mg
4450mg
188%
Vitamin D*
87 IU
1006 IU
115%
Vitamin D
2.2µg
25.2µg
115%
Cholesterol
373mg
95mg
93%
Selenium
30.8µg
73.4µg
77%
Choline
293.8mg
101.6mg
35%
Polyunsaturated fat
1.414g
6.21g
32%
Vitamin B5
1.398mg
28%
Vitamin B2
0.513mg
0.19mg
25%
Fats
10.61g
25.1g
22%
Vitamin B6
0.121mg
0.41mg
22%
Vitamin B3
0.064mg
3.3mg
20%
Saturated fat
3.267g
7.148g
18%
Protein
12.58g
18.5g
12%
Magnesium
10mg
60mg
12%
Potassium
126mg
520mg
12%
Phosphorus
172mg
254mg
12%
Vitamin A
149µg
47µg
11%
Monounsaturated fat
4.077g
8.32g
11%
Vitamin E
1.03mg
2.38mg
9%
Calories
155kcal
305kcal
8%
Folate
44µg
15µg
7%
Vitamin K
0.3µg
7.8µg
6%
Vitamin B1
0.066mg
0.02mg
4%
Iron
1.19mg
1.4mg
3%
Calcium
50mg
66mg
2%
Manganese
0.026mg
1%
Protein per 100 calories
8.1g
6.1g
N/A
Calories per 10 g protein
123kcal
165kcal
N/A
Weight per 100 calories
65g
33g
N/A
Unsaturated / Saturated Fat ratio
1.7
2
N/A
Net carbs
1.12g
0g
N/A
Carbs
1.12g
0g
0%
Sugar
1.12g
0g
N/A
Zinc
1.05mg
1.1mg
0%
Tryptophan
0.153mg
0%
Threonine
0.604mg
0%
Isoleucine
0.686mg
0%
Leucine
1.075mg
0%
Lysine
0.904mg
0%
Methionine
0.392mg
0%
Phenylalanine
0.668mg
0%
Valine
0.767mg
0%
Histidine
0.298mg
0%
Omega-3 - EPA
0.005g
1.619g
N/A
Omega-3 - DHA
0.038g
2.965g
N/A
Omega-3 - DPA
0g
0.391g
N/A
Macronutrient Comparison
Macronutrient breakdown side-by-side comparison
2
13%
11%
75%
Protein:
12.58 g
Fats:
10.61 g
Carbs:
1.12 g
Water:
74.62 g
Other:
1.07 g
3
19%
25%
43%
13%
Protein:
18.5 g
Fats:
25.1 g
Carbs:
0 g
Water:
43 g
Other:
13.4 g
Contains
more
Carbs Carbs
+∞%
Contains
more
Water Water
+73.5%
Contains
more
Protein Protein
+47.1%
Contains
more
Fats Fats
+136.6%
Contains
more
Other Other
+1152.3%
Fat Type Comparison
Fat type breakdown side-by-side comparison
1
37%
47%
16%
Saturated fat:
Sat. Fat
3.267 g
Monounsaturated fat:
Mono. Fat
4.077 g
Polyunsaturated fat:
Poly. Fat
1.414 g
2
33%
38%
29%
Saturated fat:
Sat. Fat
7.148 g
Monounsaturated fat:
Mono. Fat
8.32 g
Polyunsaturated fat:
Poly. Fat
6.21 g
Contains
less
Sat. Fat Saturated fat
-54.3%
Contains
more
Mono. Fat Monounsaturated fat
+104.1%
Contains
more
Poly. Fat Polyunsaturated fat
+339.2%