Egg nutrition: calories, carbs, GI, protein, fiber, fats
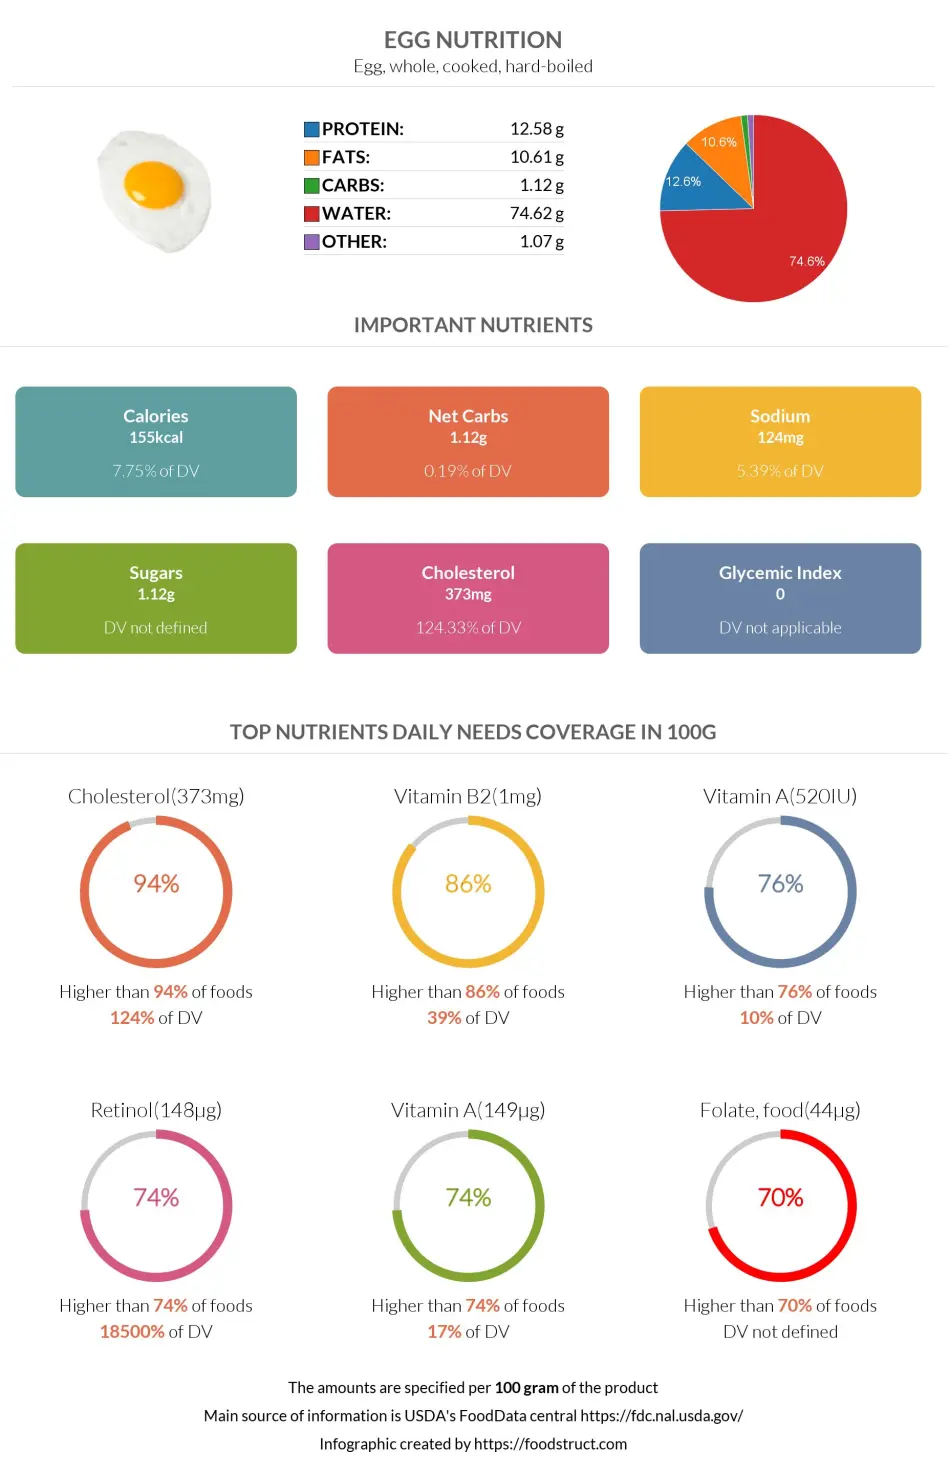
Egg, whole, cooked, hard-boiled
*all the values are displayed for the amount of 100 grams
Medically reviewed by Elen Khachatrian


What Do 155 Calories or 100 Grams of Eggs Look Like?
The image shows 100 grams of boiled eggs, which provide approximately 155 calories. Most of the calories come from fats, with a significant portion from healthy unsaturated fats and protein.
A default serving of eggs is 1 large (50 grams), with their weight increasing slightly after boiling. Despite their fat content, eggs remain a balanced and nutrient-dense food choice, especially due to their high protein content.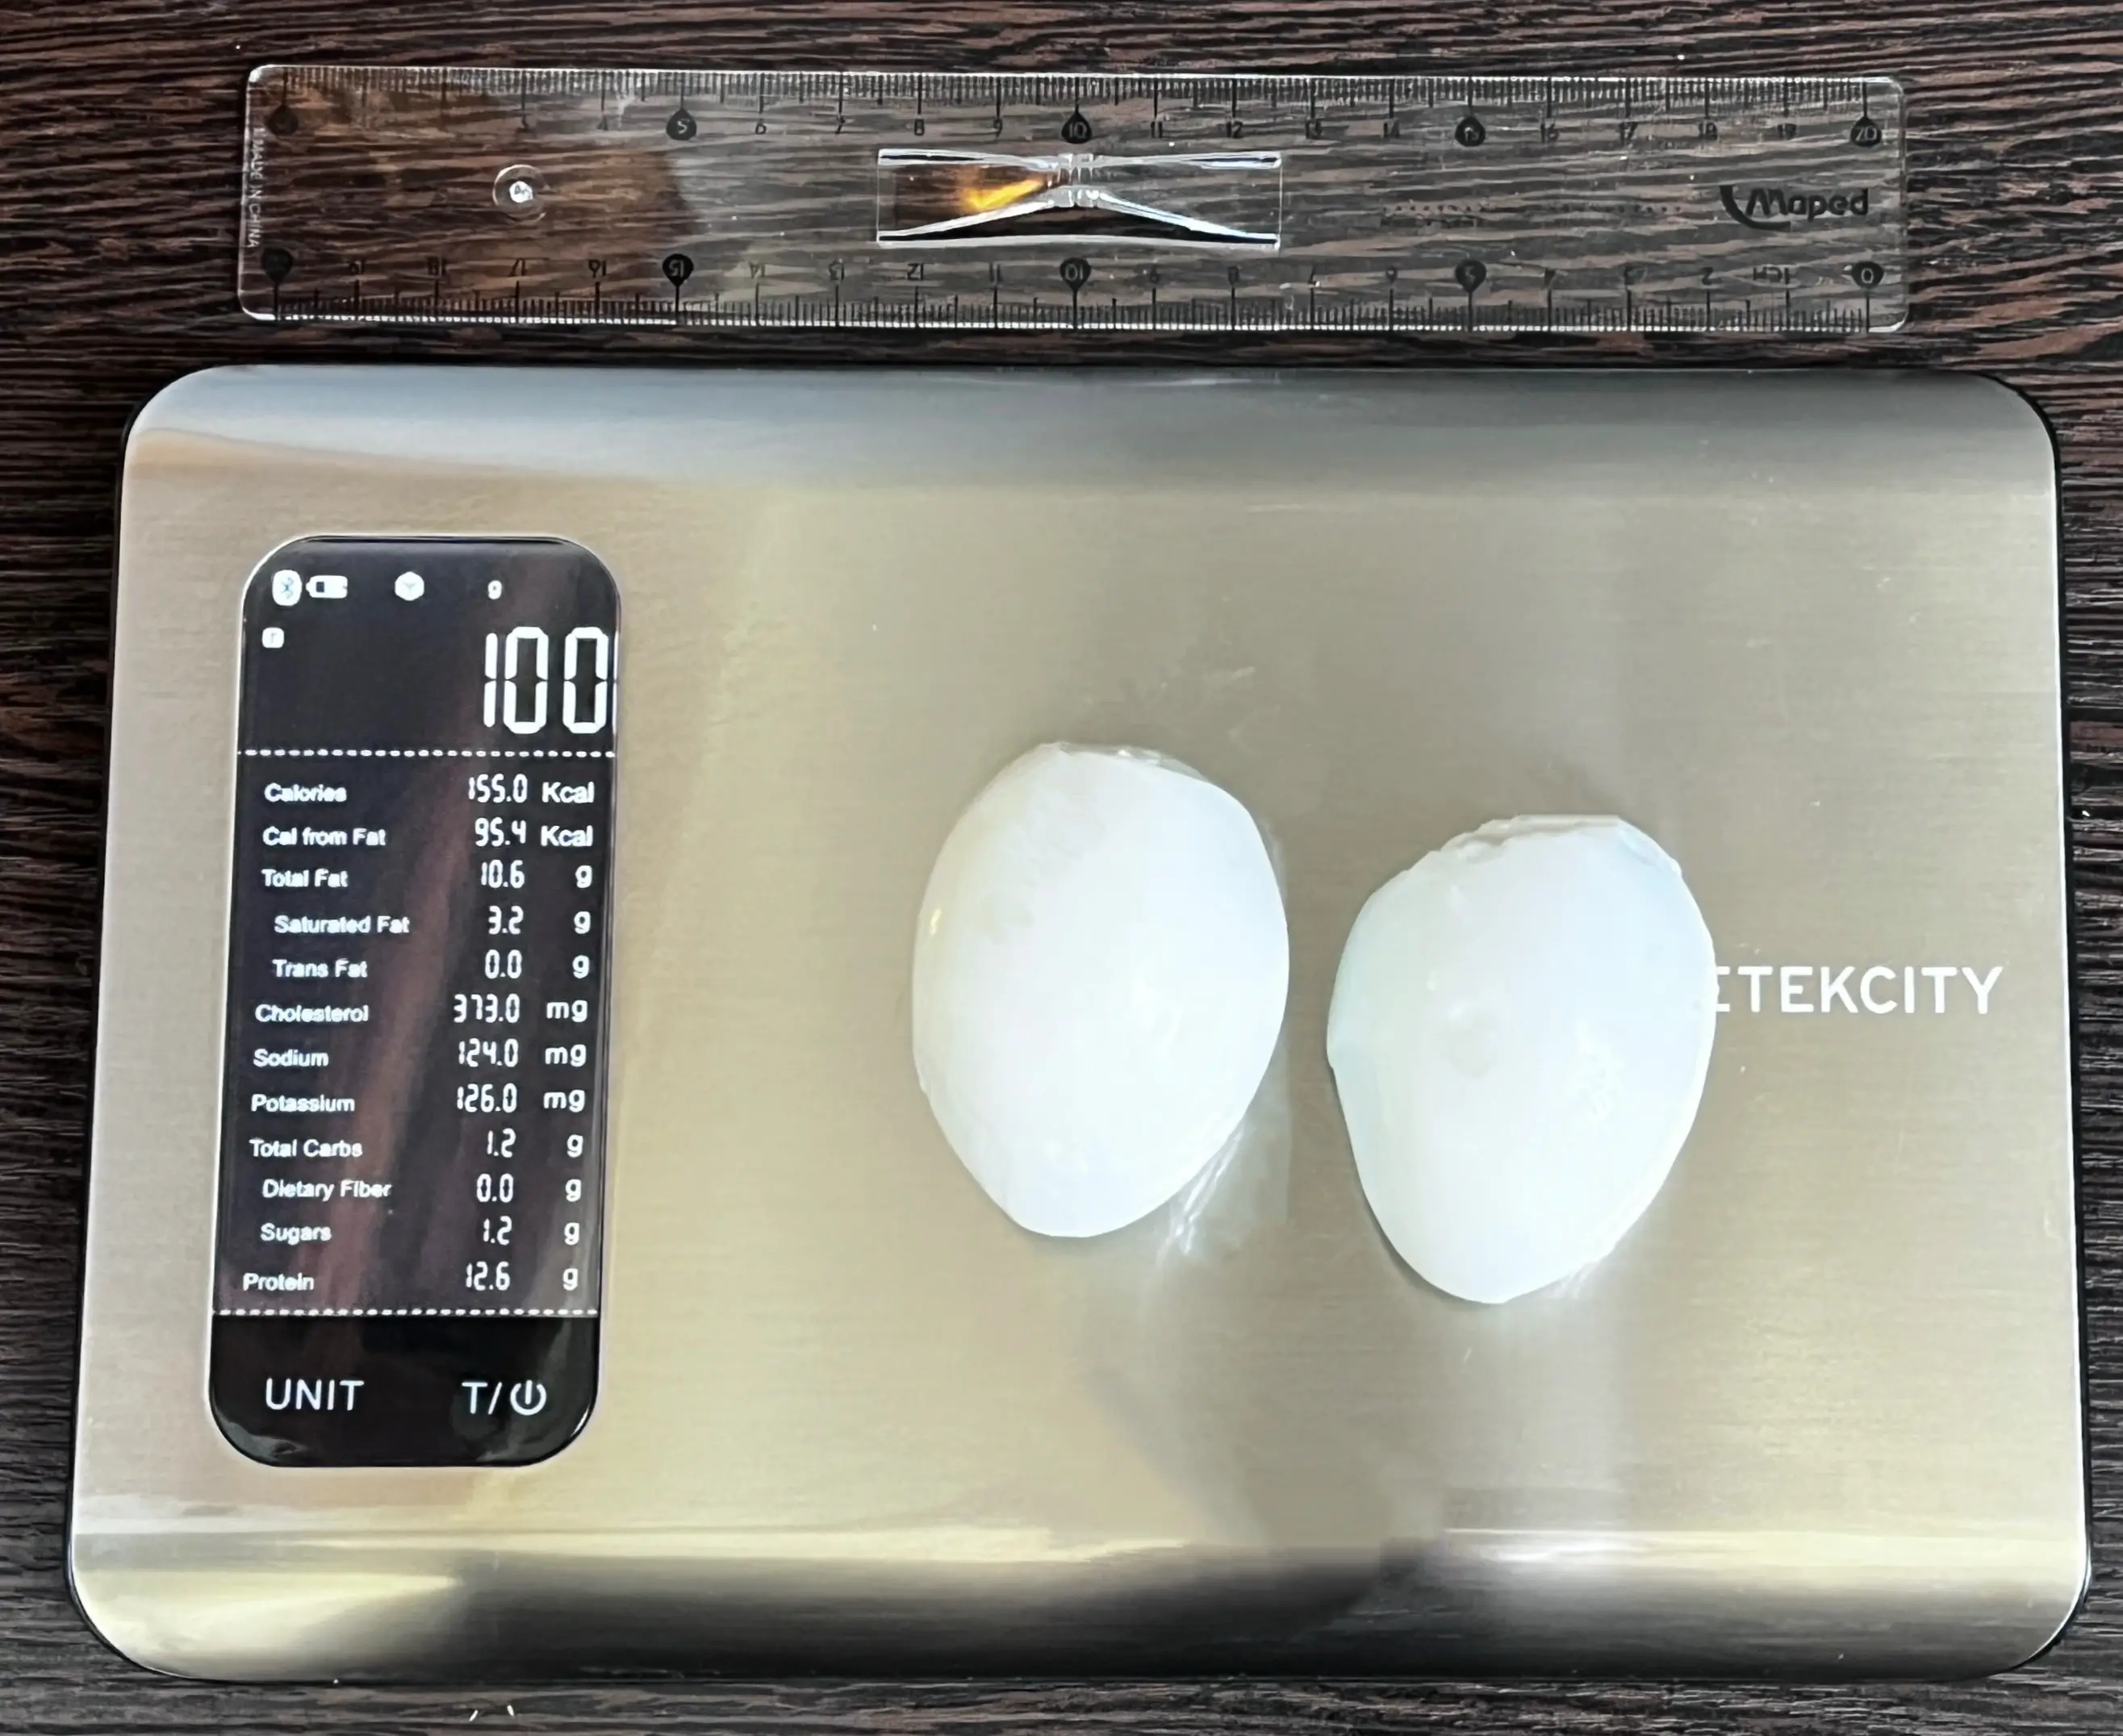

Education: General Medicine at YSMU
Last updated: August 22, 2024
Medically reviewed by Elen Khachatrian
Top nutrition facts for Egg
| Calories ⓘ Calories for selected serving | 155 kcal |
|
Glycemic index ⓘ
Source: Check out our full article on Egg glycemic index https://www.sciencedirect.com/science/article/pii/S0002916522004944Check out our Glycemic index chart page for the full list.
|
0 (low) |
| Glycemic load ⓘ Glycemic Load (GL) is a metric that measures both the quality (Glycemic Index) and quantity of carbohydrates in a specific serving of food to estimate its impact on blood sugar levels. It is calculated as: (GI × Carbs in grams) / 100. | 0 (low) |
| Insulin index ⓘ The insulin index of foods demonstrates how much a food increases the insulin level in the blood, in the first two-hour period after consumption. | 23 ⓘ https://clinicaltrials.gov/ProvidedDocs/93/NCT03387293/Prot_SAP_000.pdf – II for boiled egg is 23 |
| Net carbs ⓘ Net Carbs = Total Carbohydrates – Fiber – Sugar Alcohols | 1 g |
| Default serving size ⓘ Serving sizes are mostly taken from FDA's Reference Amounts Customarily Consumed (RACCs) | 1 large (50 g) |
| Acidity (Based on PRAL) ⓘ PRAL (Potential renal acid load) is calculated using a formula. On the PRAL scale the higher the positive value, the more is the acidifying effect on the body. The lower the negative value, the higher the alkalinity of the food. 0 is neutral. | 9 (acidic) |
| Oxalates | 0 mg ⓘ Animal products do not contain oxalate. |
Egg calories (kcal)
| Calories for different serving sizes of egg | Calories | Weight |
|---|---|---|
| Calories in 100 grams | 155 | |
| Calories in 1 tbsp | 13 | 8.5 g |
| Calories in 1 large | 78 | 50 g |
| Calories in 1 cup, chopped | 211 | 136 g |
| Calories for different varieties of egg | Calories | Weight |
|---|---|---|
| Egg, whole, cooked, hard-boiled (this food) | 155 | 100 g |
| Egg, whole, raw, frozen, salted, pasteurized | 138 | 100 g |
| Egg, whole, raw, fresh | 143 | 100 g |
| Egg, whole, cooked, poached | 143 | 100 g |
| Egg, whole, raw, frozen, pasteurized | 147 | 100 g |
| Egg, whole, cooked, scrambled | 149 | 100 g |
| Egg, whole, cooked, fried | 196 | 100 g |
| Egg Mix, USDA Commodity | 555 | 100 g |
| Egg, whole, dried | 592 | 100 g |
| Egg, whole, dried, stabilized, glucose reduced | 615 | 100 g |
Extra Nutrition facts for Egg
| Protein per 100 calories ⓘ Shows how many grams of protein you get from 100 calories of this food, calculated as (protein in g ÷ calories) × 100. | 8.1 g |
| Calories per 10 g protein ⓘ Shows how many calories you need to eat from this food to get 10 g of protein, calculated as (calories ÷ protein in g) × 10. | 123 kcal |
| Weight per 100 calories ⓘ Shows how many grams of this food equal 100 kcal—higher grams mean a larger portion for the same calories. | 65 g |
| Unsaturated / Saturated Fat ratio ⓘ (monounsaturated + polyunsaturated) / saturated, ≥2 broadly recommended by major guidelines for heart health | 1.7 |
| Processing score ⓘ The processing score is a calculated value that looks at both how industrially made it is (NOVA) and how healthy/unprocessed the ingredients are (SIGA), then combines them into one score from 1 (least processed) to 4 (most processed). | 1 - Unprocessed ⓘ (Boiled, fried) NOVA score = 1, SIGA score = A0 |
Egg Glycemic index (GI)
Source:
Check out our full article on Egg glycemic index
https://www.sciencedirect.com/science/article/pii/S0002916522004944Check out our Glycemic index chart page for the full list.
Mineral coverage chart
Mineral chart - relative view
Vitamin coverage chart
Vitamin A:
447µg of 900µg
50%
Vitamin E:
3.1mg of 15mg
21%
Vitamin D:
6.6µg of 20µg
33%
Vitamin C:
0mg of 90mg
0%
Vitamin B1:
0.2mg of 1mg
17%
Vitamin B2:
1.5mg of 1mg
118%
Vitamin B3:
0.19mg of 16mg
1.2%
Vitamin B5:
4.2mg of 5mg
84%
Vitamin B6:
0.36mg of 1mg
28%
Folate:
132µg of 400µg
33%
Vitamin B12:
3.3µg of 2µg
139%
Vitamin K:
0.9µg of 120µg
0.75%
Vitamin chart - relative view
Macronutrients chart
Protein:
Daily Value: 25%
12.6 g of 50 g
12.6 g (25% of DV )
Fats:
Daily Value: 16%
10.6 g of 65 g
10.6 g (16% of DV )
Carbs:
Daily Value: 0%
1.1 g of 300 g
1.1 g (0% of DV )
Water:
Daily Value: 4%
74.6 g of 2,000 g
74.6 g (4% of DV )
Other:
1.1 g
1.1 g
Protein quality breakdown
Tryptophan:
459mg of 280mg
164%
Threonine:
1812mg of 1,050mg
173%
Isoleucine:
2058mg of 1,400mg
147%
Leucine:
3225mg of 2,730mg
118%
Lysine:
2712mg of 2,100mg
129%
Methionine:
1176mg of 1,050mg
112%
Phenylalanine:
2004mg of 1,750mg
115%
Valine:
2301mg of 1,820mg
126%
Histidine:
894mg of 700mg
128%
Fat type information
Saturated fat:
3.3 g
Monounsaturated fat:
4.1 g
Polyunsaturated fat:
1.4 g
Fiber content ratio for Egg
Sugar:
1.1 g
Fiber:
0 g
Other:
0 g
All nutrients for Egg per 100g
| Nutrient | Value | DV% | In TOP % of foods | Comparison |
| Vitamin A | 149µg | 17% | 9% | |
| Calories | 155kcal | 8% | 59% |
3.3 times more than Orange
|
| Protein | 13g | 30% | 38% |
4.5 times more than Broccoli
|
| Protein per 100 calories | 8.1g | N/A | 31% | |
| Calories per 10 g protein | 123kcal | N/A | 65% | |
| Weight per 100 calories | 65g | N/A | 42% | |
| Fats | 11g | 16% | 33% |
3.1 times less than Cheese
|
| Unsaturated / Saturated Fat ratio | 1.7 | N/A | 52% | |
| Vitamin C | 0mg | 0% | 100% |
N/A
|
| Net carbs | 1.1g | N/A | 69% |
48.4 times less than Chocolate
|
| Carbs | 1.1g | 0% | 70% |
25.2 times less than Rice
|
| Cholesterol | 373mg | 124% | 1% |
Equal to Egg
|
| Vitamin D* | 87 IU | 11% | 4% |
Equal to Egg
|
| Vitamin D | 2.2µg | 11% | 4% |
Equal to Egg
|
| Magnesium | 10mg | 2% | 76% |
14 times less than Almonds
|
| Calcium | 50mg | 5% | 30% |
2.5 times less than Milk
|
| Potassium | 126mg | 4% | 72% |
1.2 times less than Cucumber
|
| Iron | 1.2mg | 15% | 54% |
2.2 times less than Beef broiled
|
| Sugar | 1.1g | N/A | 45% |
8 times less than Coca-Cola
|
| Fiber | 0g | 0% | 100% |
N/A
|
| Copper | 2mg | 222% | 1% |
14.1 times more than Shiitake
|
| Zinc | 1.1mg | 10% | 45% |
6 times less than Beef broiled
|
| Phosphorus | 172mg | 25% | 41% |
1.1 times less than Chicken meat
|
| Sodium | 124mg | 5% | 46% |
4 times less than White bread
|
| Vitamin E | 1mg | 7% | 13% |
1.4 times less than Kiwi
|
| Manganese | 0.03mg | 1% | 49% | |
| Selenium | 31µg | 56% | 13% | |
| Vitamin B1 | 0.07mg | 6% | 57% |
4 times less than Pea raw
|
| Vitamin B2 | 0.51mg | 39% | 8% |
3.9 times more than Avocado
|
| Vitamin B3 | 0.06mg | 0% | 87% |
149.6 times less than Turkey meat
|
| Vitamin B5 | 1.4mg | 28% | 5% |
1.2 times more than Sunflower seeds
|
| Vitamin B6 | 0.12mg | 9% | 50% |
Equal to Oats
|
| Vitamin B12 | 1.1µg | 46% | 27% |
1.6 times more than Pork
|
| Vitamin K | 0.3µg | 0% | 44% |
338.7 times less than Broccoli
|
| Folate | 44µg | 11% | 23% |
1.4 times less than Brussels sprouts
|
| Saturated fat | 3.3g | 16% | 32% |
1.8 times less than Beef broiled
|
| Choline | 294mg | 53% | 1% | |
| Monounsaturated fat | 4.1g | N/A | 29% |
2.4 times less than Avocado
|
| Polyunsaturated fat | 1.4g | N/A | 31% |
33.4 times less than Walnut
|
| Tryptophan | 0.15mg | 0% | 30% |
2 times less than Chicken meat
|
| Threonine | 0.6mg | 0% | 30% |
1.2 times less than Beef broiled
|
| Isoleucine | 0.69mg | 0% | 29% |
1.3 times less than Salmon raw
|
| Leucine | 1.1mg | 0% | 31% |
2.3 times less than Tuna Bluefin
|
| Lysine | 0.9mg | 0% | 31% |
2 times more than Tofu
|
| Methionine | 0.39mg | 0% | 28% |
4.1 times more than Quinoa
|
| Phenylalanine | 0.67mg | 0% | 29% |
Equal to Egg
|
| Valine | 0.77mg | 0% | 29% |
2.6 times less than Soybean raw
|
| Histidine | 0.3mg | 0% | 34% |
2.5 times less than Turkey meat
|
| Caffeine | 0mg | 0% | 100% | |
| Omega-3 - EPA | 0.01g | N/A | 10% |
138 times less than Salmon
|
| Omega-3 - DHA | 0.04g | N/A | 5% |
38.4 times less than Salmon
|
| Omega-3 - DPA | 0g | N/A | 100% |
N/A
|
Check out similar food or compare with current
NUTRITION FACTS LABEL
Nutrition Facts
___servings per container
Serving Size ______________
Serving Size ______________
Amount Per 100g
Calories 155
% Daily Value*
16%
Total Fat
11g
15%
Saturated Fat 3.3g
0
Trans Fat
0g
124%
Cholesterol 373mg
5.4%
Sodium 124mg
0.37%
Total Carbohydrate
1.1g
0
Dietary Fiber
0g
Total Sugars 0g
Includes ? g Added Sugars
Protein
13g
Vitamin D
87mcg
11%
Calcium
50mg
5%
Iron
1.2mg
15%
Potassium
126mg
3.7%
*
The % Daily Value (DV) tells you how much a nutrient in a serving of food contributes to a daily diet. 2,000 calories a day is used for general nutrition advice.
Health checks
ⓘ
Dietary cholesterol is not associated with an increased risk of coronary heart disease in healthy individuals. However, dietary cholesterol is common in foods that are high in harmful saturated fats.
Source
Low in Cholesterol
ⓘ
Trans fat consumption increases the risk of cardiovascular disease and mortality by negatively affecting blood lipid levels.
Source
No Trans Fats
ⓘ
Saturated fat intake can raise total cholesterol and LDL (low-density lipoprotein) levels, leading to an increased risk of atherosclerosis. Dietary guidelines recommend limiting saturated fats to under 10% of calories a day.
Source
Low in Saturated Fats
ⓘ
While the consumption of moderate amounts of added sugars is not detrimental to health, an excessive intake can increase the risk of obesity, and therefore, diabetes.
Source
Low in Sugars
Egg nutrition infographic
Infographic link
References
All the values for which the sources are not specified explicitly are taken from FDA’s Food Central. The exact link to the food presented on this page can be found below.