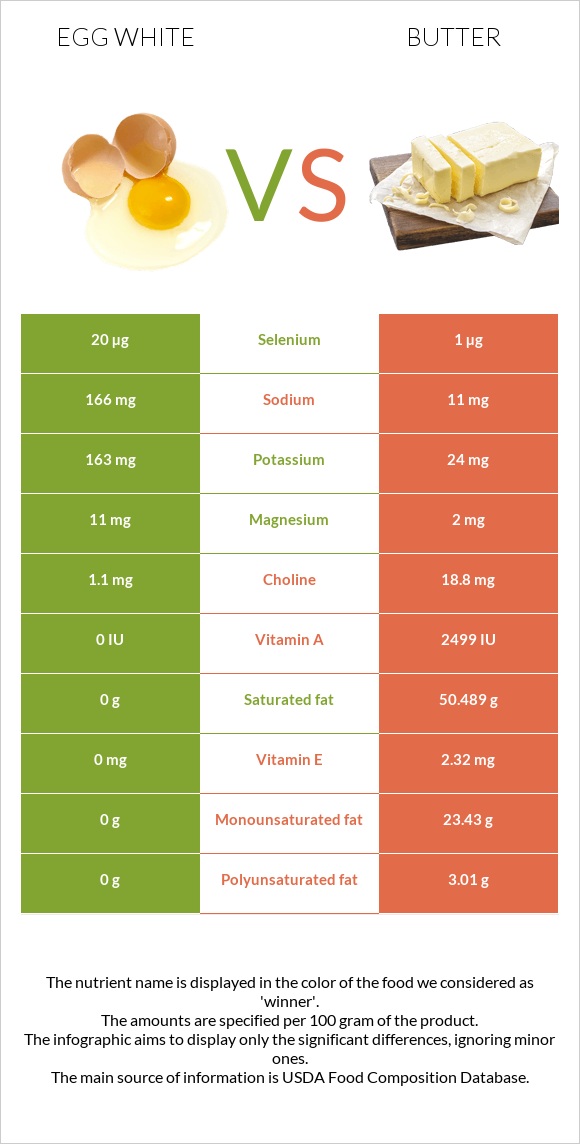
How are egg whites and butter different? Egg whites are higher in selenium and vitamin B2; however, butter is richer in vitamin A, vitamin E, and vitamin K. Daily need coverage for saturated fat for butter is 252% higher. Egg whites contain 20 times more selenium than butter. While egg whites contain 20µg of selenium, butter contains only 1µg. Butter has less sodium. Egg, white, raw, fresh and Butter, without salt are the varieties used in this article.
Infographic
Mineral Comparison
Mineral comparison score is based on the number of minerals by which one or the other food is richer. The "coverage" charts below show how much of the daily needs can be covered by 300 grams of the food.
6
100 g
300 g
1 large - 33g 1 cup - 243g
Magnesium
Magnesium
Calcium
Calcium
Potassium
Potassium
Iron
Iron
Copper
Copper
Zinc
Zinc
Phosphorus
Phosphorus
Sodium
Sodium
Manganese
Manganese
Selenium
Selenium
7.9%
2.1%
14%
3%
7.7%
0.82%
6.4%
22%
1.4%
109%
4
100 g
300 g
1 pat (1" sq, 1/3" high) - 5g 1 tbsp - 14.2g 1 stick - 113g 1 cup - 227g
Magnesium
Magnesium
Calcium
Calcium
Potassium
Potassium
Iron
Iron
Copper
Copper
Zinc
Zinc
Phosphorus
Phosphorus
Sodium
Sodium
Manganese
Manganese
Selenium
Selenium
1.4%
7.2%
2.1%
0.75%
5.3%
2.5%
10%
1.4%
0.52%
5.5%
Vitamin Comparison
Vitamin comparison score is based on the number of vitamins by which one or the other food is richer. The "coverage" charts below show how much of the daily needs can be covered by 300 grams of the food.
5
100 g
300 g
1 large - 33g 1 cup - 243g
Vitamin C
Vit. C
Vitamin D
Vit. D
Vitamin A
Vit. A
Vitamin E
Vit. E
Vitamin B1
Vit. B1
Vitamin B2
Vit. B2
Vitamin B3
Vit. B3
Vitamin B5
Vit. B5
Vitamin B6
Vit. B6
Vitamin B12
Vit. B12
Vitamin K
Vit. K
Folate
Folate
0%
0%
0%
0%
1%
101%
2%
11%
1.2%
11%
0%
3%
5
100 g
300 g
1 pat (1" sq, 1/3" high) - 5g 1 tbsp - 14.2g 1 stick - 113g 1 cup - 227g
Vitamin C
Vit. C
Vitamin D
Vit. D
Vitamin A
Vit. A
Vitamin E
Vit. E
Vitamin B1
Vit. B1
Vitamin B2
Vit. B2
Vitamin B3
Vit. B3
Vitamin B5
Vit. B5
Vitamin B6
Vit. B6
Vitamin B12
Vit. B12
Vitamin K
Vit. K
Folate
Folate
0%
0%
228%
46%
1.3%
7.8%
0.79%
6.6%
0.69%
21%
18%
2.3%
All nutrients comparison - raw data values
Nutrient
DV% diff.
Saturated fat
0g
50.489g
229%
Fats
0.17g
81.11g
125%
Vitamin A
0µg
684µg
76%
Cholesterol
0mg
215mg
72%
Monounsaturated fat
0g
23.43g
59%
Selenium
20µg
1µg
35%
Calories
52kcal
717kcal
33%
Vitamin B2
0.439mg
0.034mg
31%
Protein
10.9g
0.85g
20%
Polyunsaturated fat
0g
3.01g
20%
Vitamin E
0mg
2.32mg
15%
Sodium
166mg
11mg
7%
Vitamin K
0µg
7µg
6%
Potassium
163mg
24mg
4%
Vitamin B12
0.09µg
0.17µg
3%
Choline
1.1mg
18.8mg
3%
Magnesium
11mg
2mg
2%
Calcium
7mg
24mg
2%
Vitamin B5
0.19mg
0.11mg
2%
Iron
0.08mg
0.02mg
1%
Copper
0.023mg
0.016mg
1%
Zinc
0.03mg
0.09mg
1%
Phosphorus
15mg
24mg
1%
Protein per 100 calories
21g
0.12g
N/A
Calories per 10 g protein
48kcal
8435kcal
N/A
Weight per 100 calories
192g
14g
N/A
Unsaturated / Saturated Fat ratio
0.52
N/A
Net carbs
0.73g
0.06g
N/A
Carbs
0.73g
0.06g
0%
Sugar
0.71g
0.06g
N/A
Manganese
0.011mg
0.004mg
0%
Vitamin B1
0.004mg
0.005mg
0%
Vitamin B3
0.105mg
0.042mg
0%
Vitamin B6
0.005mg
0.003mg
0%
Folate
4µg
3µg
0%
Tryptophan
0.125mg
0.012mg
0%
Threonine
0.449mg
0.038mg
0%
Isoleucine
0.661mg
0.051mg
0%
Leucine
1.016mg
0.083mg
0%
Lysine
0.806mg
0.067mg
0%
Methionine
0.399mg
0.021mg
0%
Phenylalanine
0.686mg
0.041mg
0%
Valine
0.809mg
0.057mg
0%
Histidine
0.29mg
0.023mg
0%
Fructose
0.07g
0%
Omega-3 - ALA
0.315g
N/A
Omega-6 - Linoleic acid
2.166g
N/A
Macronutrient Comparison
Macronutrient breakdown side-by-side comparison
4
11%
88%
Protein:
10.9 g
Fats:
0.17 g
Carbs:
0.73 g
Water:
87.57 g
Other:
0.63 g
1
81%
18%
Protein:
0.85 g
Fats:
81.11 g
Carbs:
0.06 g
Water:
17.94 g
Other:
0.04 g
Contains
more
Protein Protein
+1182.4%
Contains
more
Carbs Carbs
+1116.7%
Contains
more
Water Water
+388.1%
Contains
more
Other Other
+1475%
Contains
more
Fats Fats
+47611.8%